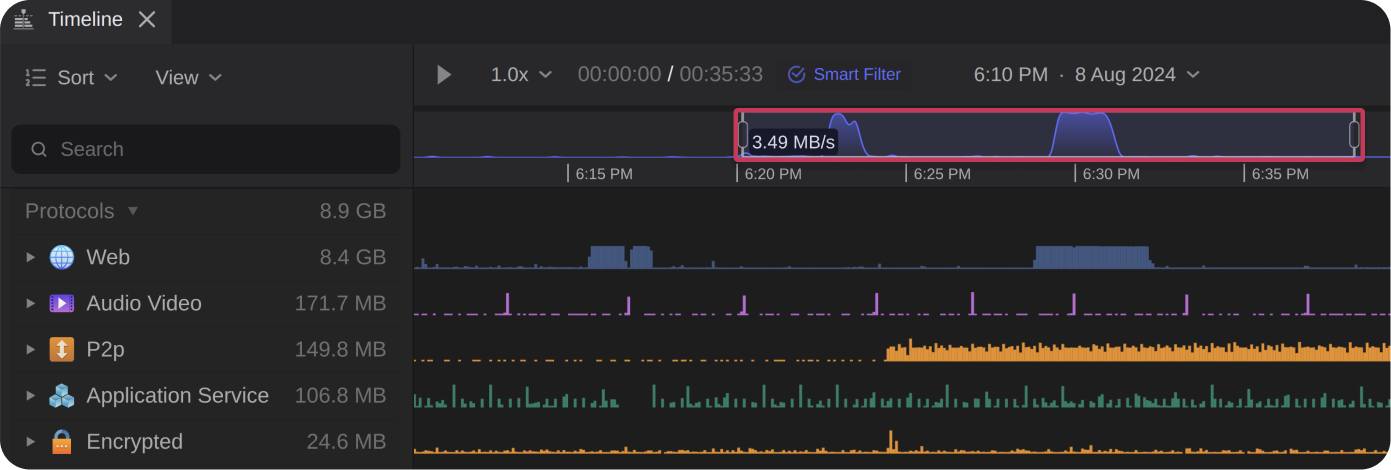
The Timeline provides an interactive view of all network traffic captured in the project telemetry. Each block represents a specific time interval during which data was transferred. Hovering over a protocol block displays the amount of data transferred during that interval. Selecting traffic populates the Inspector panel with detailed information about the associated flow(s).
When the Smart Filter is enabled (on by default), selecting a host in the Network topology automatically updates the timeline to show only traffic generated by the selected host(s).
Note: Timeline blocks are not generated for Bro/Zeek logs.
Protocol Listing
The protocol listing on the left side of the timeline displays all identified protocol families/groups within the project telemetry filtered by host selection. Expanding a protocol group reveals the individual protocols within it as swim lanes. Selecting a protocol header expands the protocol tree to reveal all swim lanes for that protocol.
Use the ••• menu next to Protocols at the top of the list to expand or collapse the entire protocol list at once.
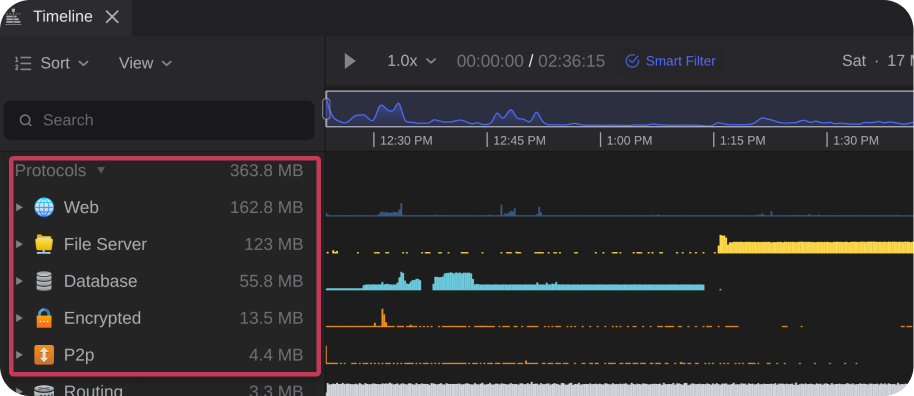
Use the three-dot menu (•••) next to a specific protocol to:
- Choose Select All and select all timeline blocks for that protocol.
- Choose Change Color to customize the display color for that protocol.
Selecting the Sort drop-down allows for sorting the protocols, or events by specific criteria.
Selecting the View icon allows for toggling whether hidden items or events can be viewed.
Managing Swim Lanes
Swim lanes allow you to control which protocol traffic is visible in the timeline. To show or hide swim lanes, select View ➜ Show Hidden.
Timeline Interaction
The interactive timeline supports filtering and navigation to enable detailed analysis.
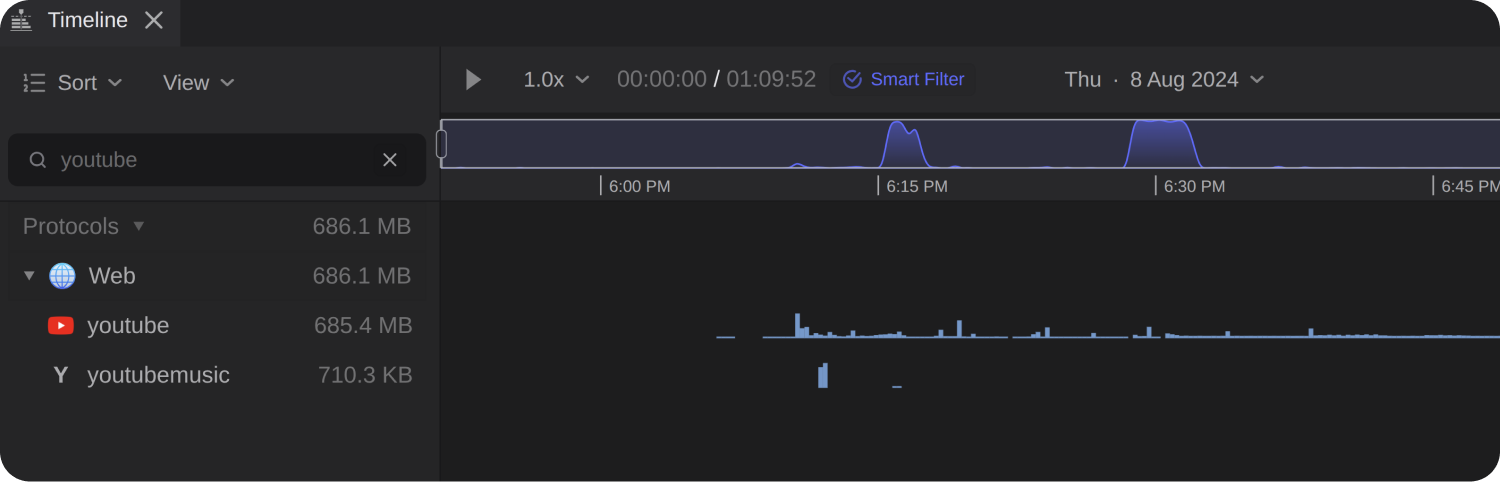
Timeline Search
Use the timeline search field to find specific protocols within the current data set. Enter a protocol name to update the timeline and display matching results.
Timeline Zoom
Zoom in or out of the timeline by dragging the timeline handles or by holding CTRL and scrolling with the mouse wheel.
Timeline Events
Timeline events highlight significant activity, including authentication attempts, file transfers, and network scans.
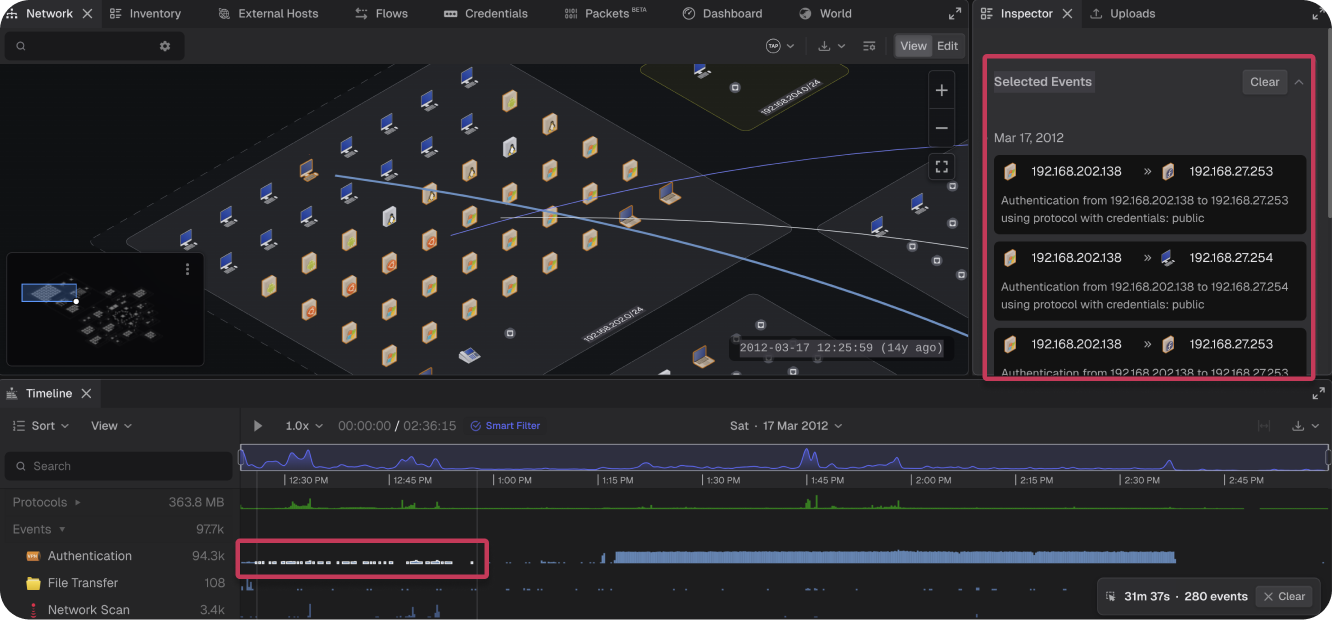
Selecting events displays event details in the Inspector panel under Selected Events. To select multiple events or timeline blocks, click and drag across the desired items.
Exporting Timeline Data
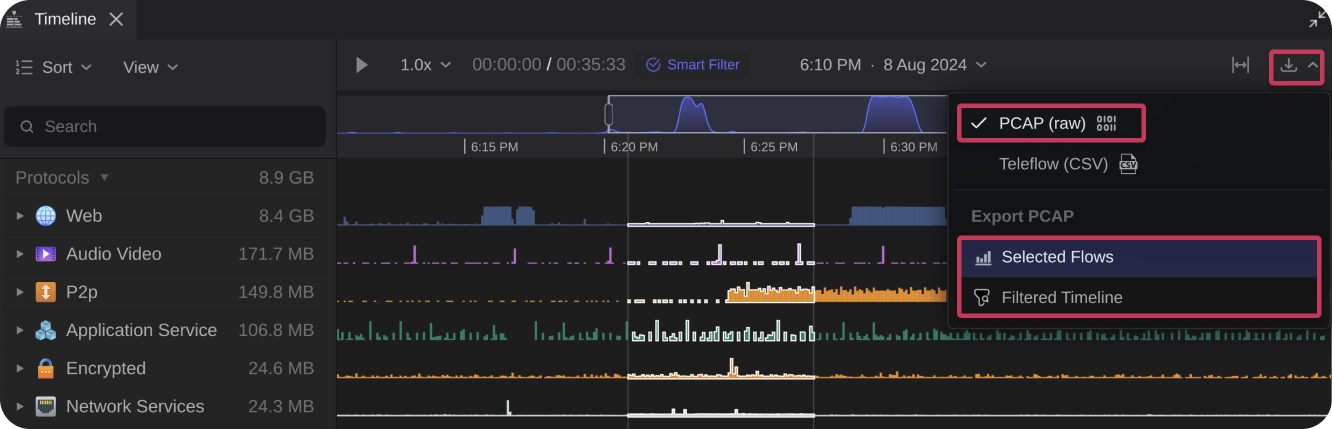
Export as PCAP
The timeline can be exported as a PCAP file. The export for Selected Flows includes only the data flow blocks selected, while the export for Filtered Timeline includes only the data visible at the current zoom level and respects any active filters.
Export as Teleflow (CSV)
The timeline can be exported as a CSV (Teleflow) file. The export can be either the Full Timeline, the currently Filtered Timeline view, or the Selected Flows.
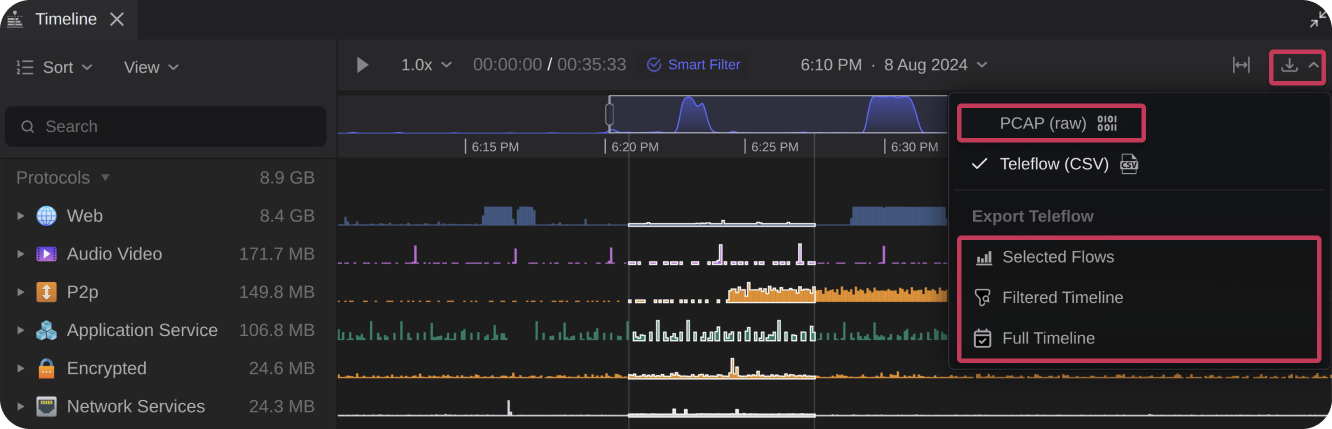
Note: The exported file is saved with the naming convention teleseer_pcap_export.Clearing Selections
Clear timeline selections at any time by selecting Clear when it appears, or by clicking the background area between swim lanes. Clearing a timeline selection also clears related selections in the Inspector and Network panels.