The Inspector panel displays detailed information about selected traffic, hosts, subnets, or packets. Its contents update based on the current selection.
Default View
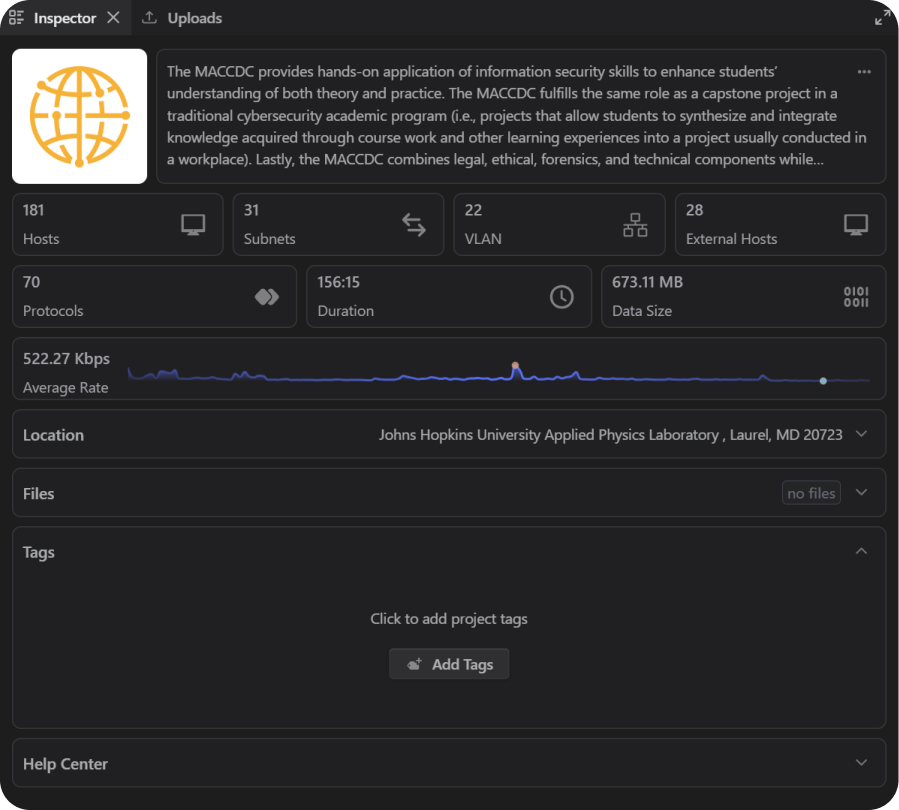
When nothing is selected, the Inspector panel displays general information about the current project.
Selected Host
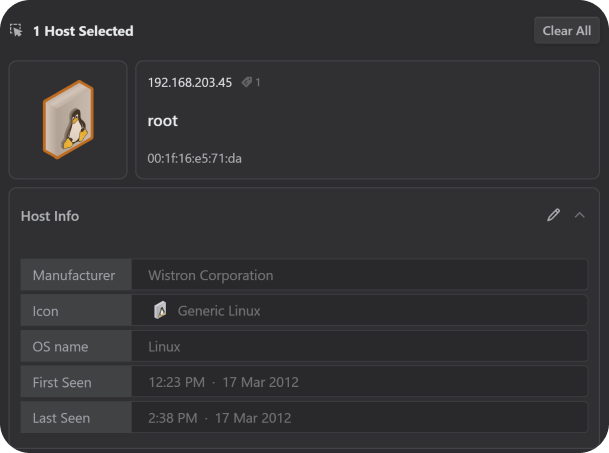
To view host-specific details, select a host from the Network, Inventory, and External Hosts panels.
Summary
Provides a high-level overview of the host, including IP address(es), MAC address(es), and hostname(s).
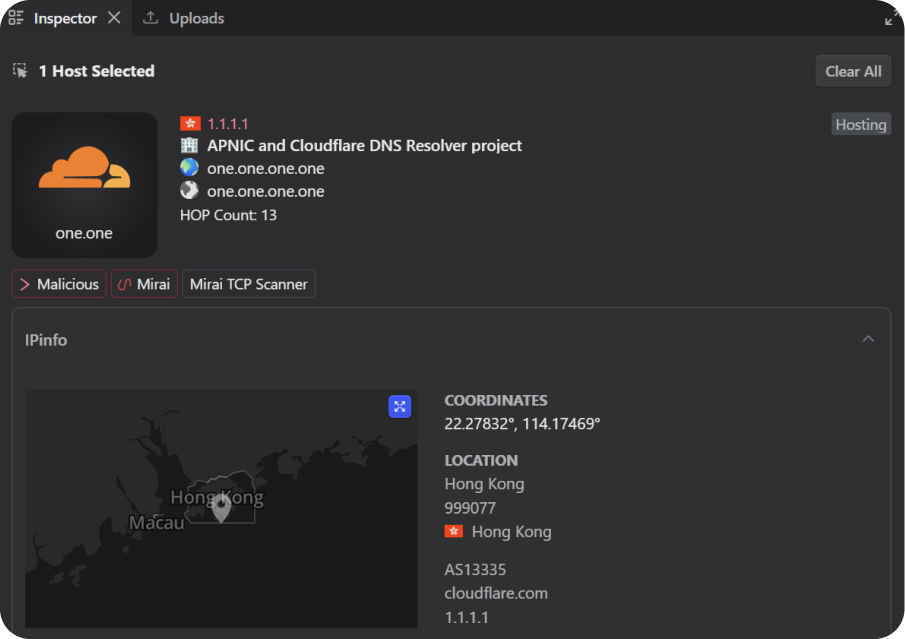
IPinfo / GreyNoise Lookup
IPinfo provides IP geolocation data, including geographic location, organization, domain, and organization type (when available).
GreyNoise analyzes Internet-wide scanning and attack activity and is integrated directly into Teleseer.
When a host is selected, available IPinfo and GreyNoise metadata is displayed automatically.
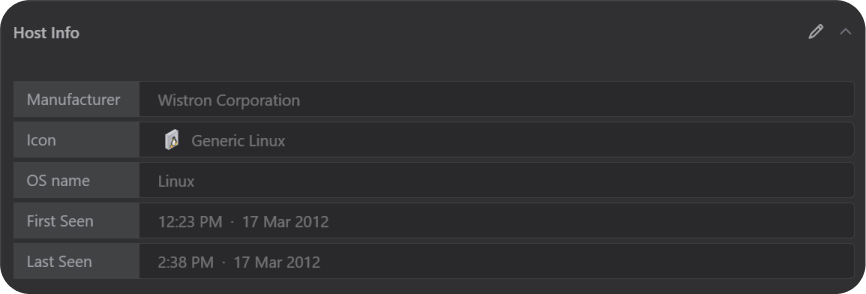
Host Info
Displays detailed host attributes such as manufacturer, form factor, operating system, and version. Analysts can add or edit information if additional context is known.
Host Tags
Tags are keywords or phrases used to identify and filter hosts. Common tags and colors can be applied to selected hosts.
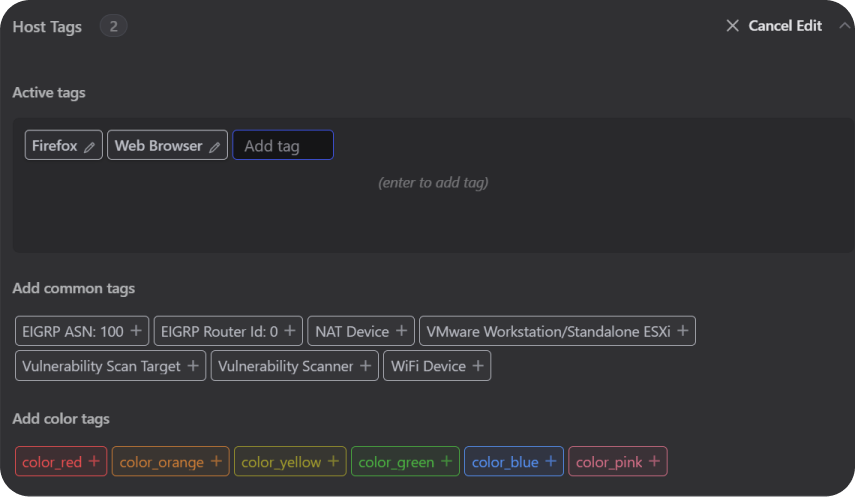
Adding Tags
- Select a host.
- In the Inspector panel, scroll to the Tags section.
- Select the edit (✎) icon.
- Enter a tag and select Add.
- Repeat as needed, then close the panel.
Tagged hosts can be searched from the Network, Inventory, and External Hosts panels.
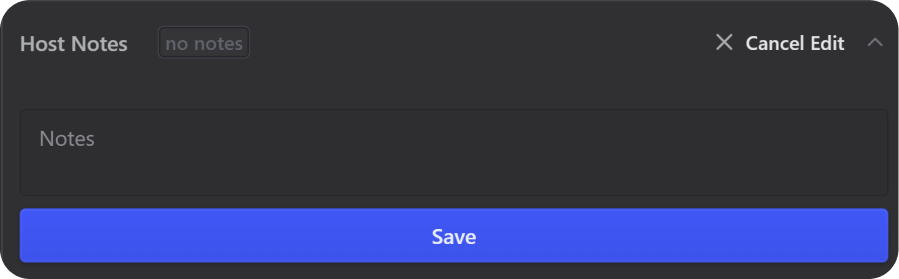
Host Notes
Custom notes added by analysts. Notes are searchable.
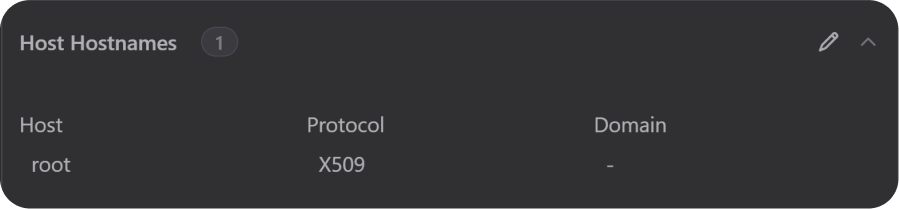
Host Hostnames
Displays an aggregated list of hostnames identified on the selected host, including hostname, protocol, and domain.
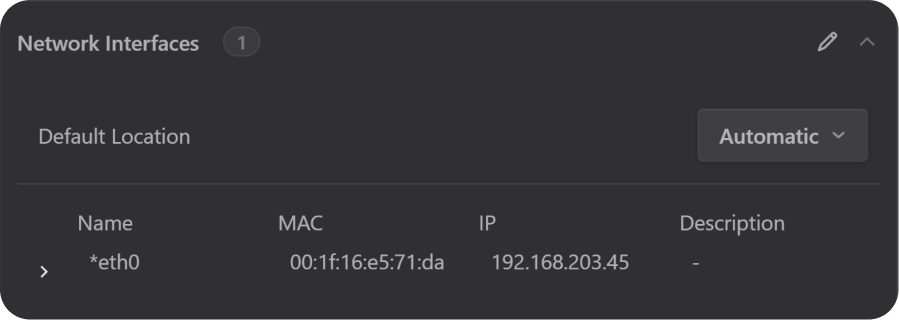
Network Interfaces
A host can have one or more network interfaces. For example, a router may contain multiple subnets, each assigned to a separate interface. All detected interfaces are displayed in this section, along with available details such as the interface name, MAC address, IP address, and description.
Note: Editable sections in the Selected Host view can be modified using the ✎ icons.
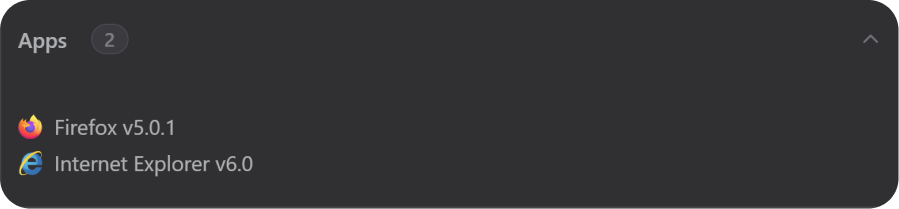
Apps
Displays applications identified by Deep Packet Inspection (DPI).
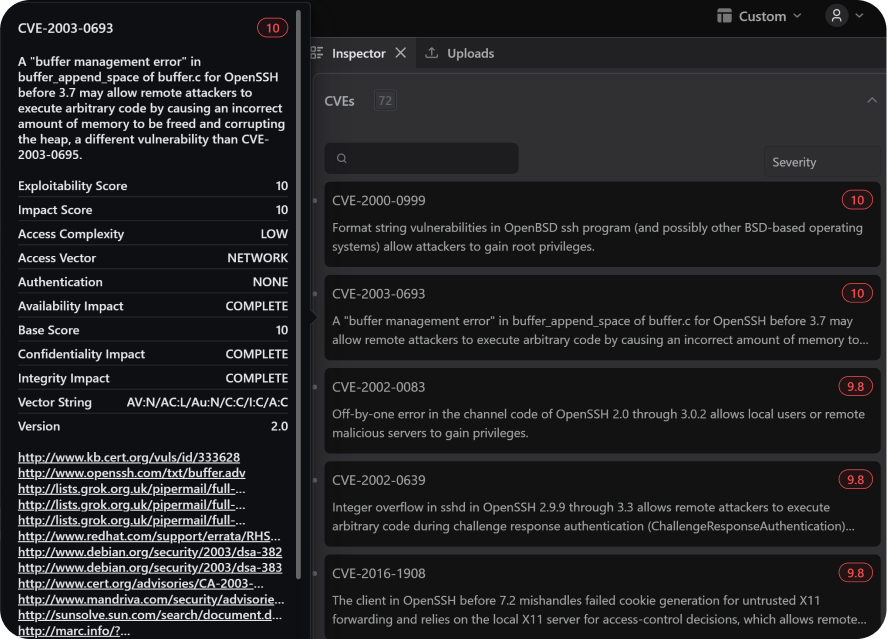
CVEs
CVEs (Common Vulnerabilities and Exposures) are publicly disclosed security vulnerabilities. Hosts with identified CVEs should be investigated further.
Hosts with detected vulnerabilities appear in the Network panel in orange.
Example:
No CVEs detected
1 or more CVEs detected
CVEs follow the format CVE-YYYY-NNNN, where YYYY is the year and NNNN is a unique identifier. For more information, see https://www.cve.org/
Each CVE entry includes a name, description, and reference link. Hover over a CVE to view additional details.
Note: If service pack information is unavailable, additional CVEs may be reported because all CVEs for the detected OS version are included.
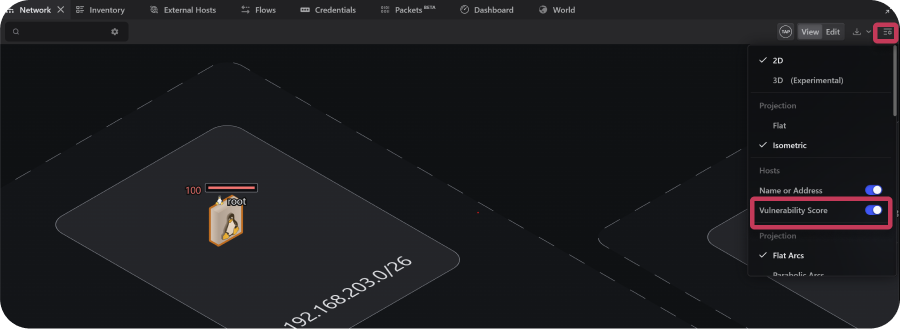
Vulnerability Scoring
Each host in the Network panel are assigned a vulnerability score based on identified CVEs and common vulnerability scanners.
Enabling Vulnerability Scoring
- Open the Network panel.
- Select Network View Settings icon.
- From the dropdown toggle Vulnerability Score
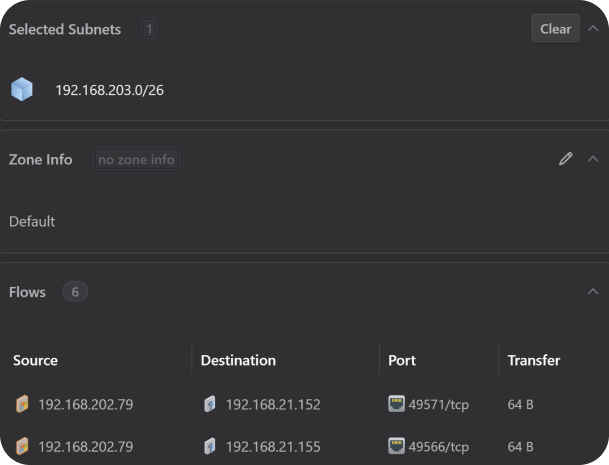
Subnets
Selecting a subnet displays its IP range, zone, and associated flows in the Inspector panel. To rename or recolor a subnet zone, select the edit (✎) icon.
Packets
Selecting one or more packets displays corresponding header and payload details in the Inspector panel. For protocol-specific details, refer to IETF RFC documentation.
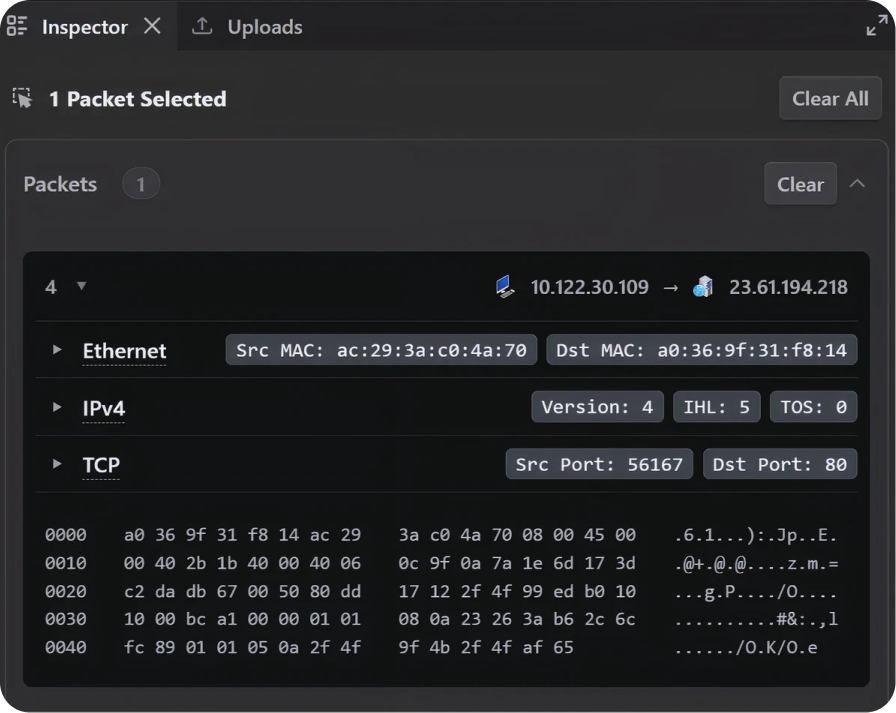
Note: If multiple flows are selected in the timeline and a packet from one of those flows is selected, the Inspector panel displays both the packet details and all selected flows. This does not imply that the packet belongs to every displayed flow.
Flows
Selecting timeline blocks or packet rows displays the associated flows in the Inspector panel, including source IP, destination IP, protocol, and bytes transferred.
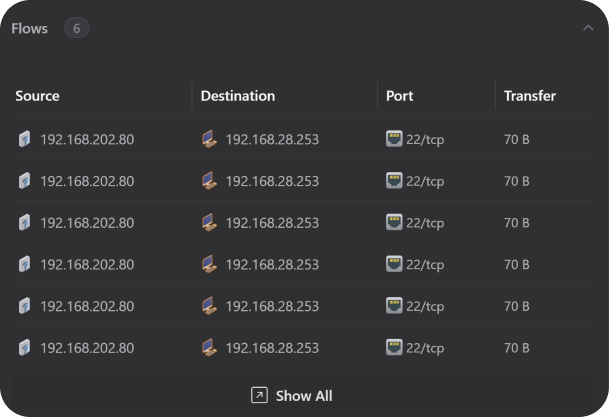
Select Show All to display all flows.
Inspector Panel Behavior
New selections replace the currently displayed content in the Inspector panel. For example, selecting a timeline block replaces any previously selected packets, hosts, or flows with the flows associated with that timeline selection.