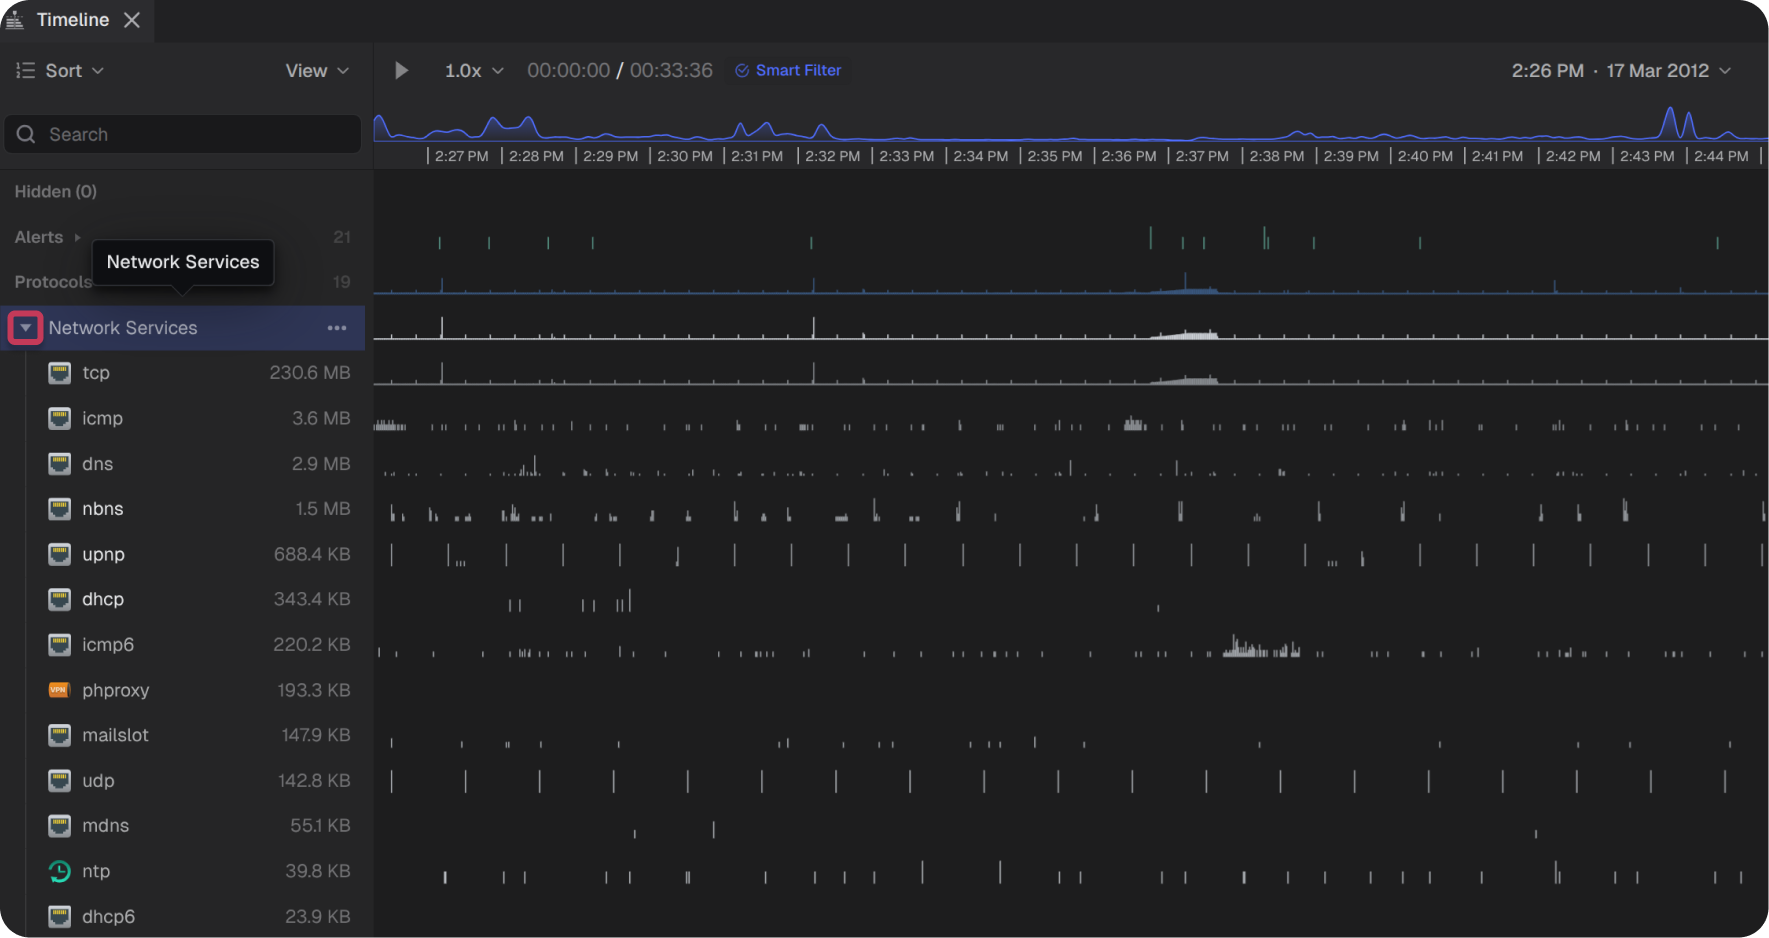
By default, the Timeline panel displays protocol traffic sorted in descending order (most to least) by bandwidth usage. To identify which applications and protocols are using the most traffic:
1. Load the target project
2. Select the Timeline panel
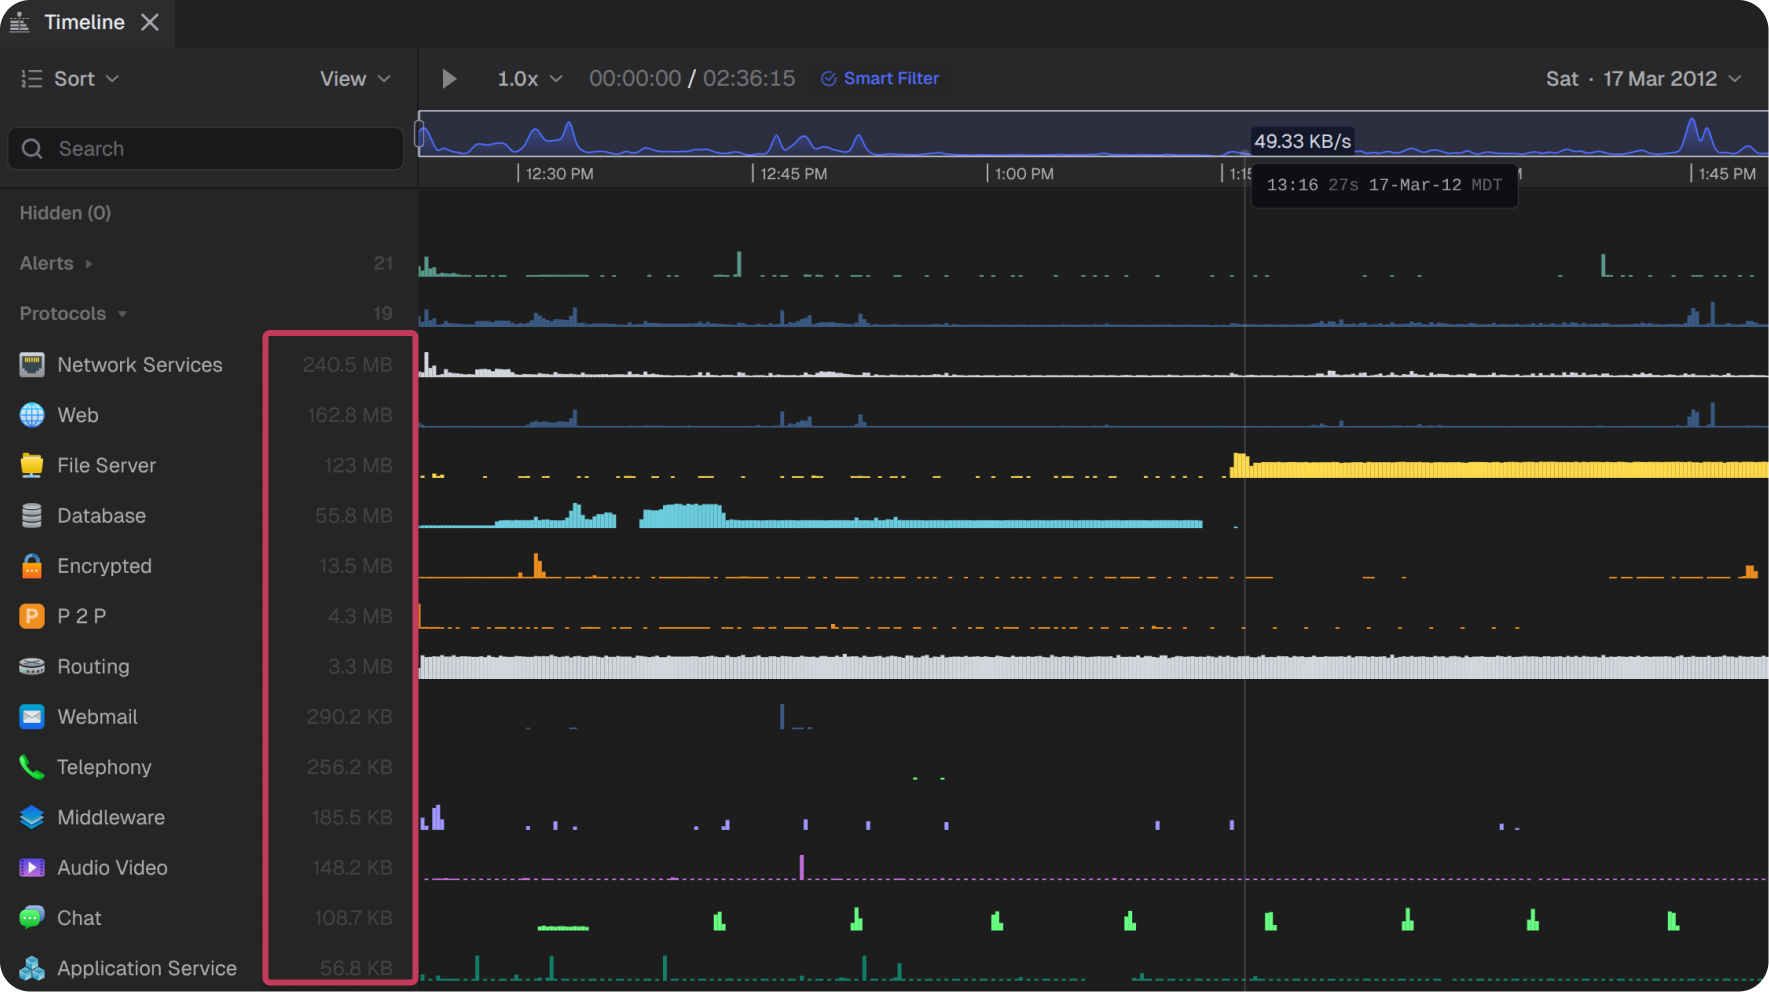
3. Expand the target protocol group(s)