The Teleseer user interface consists of two main application pages:
- Workspace
- Project Page
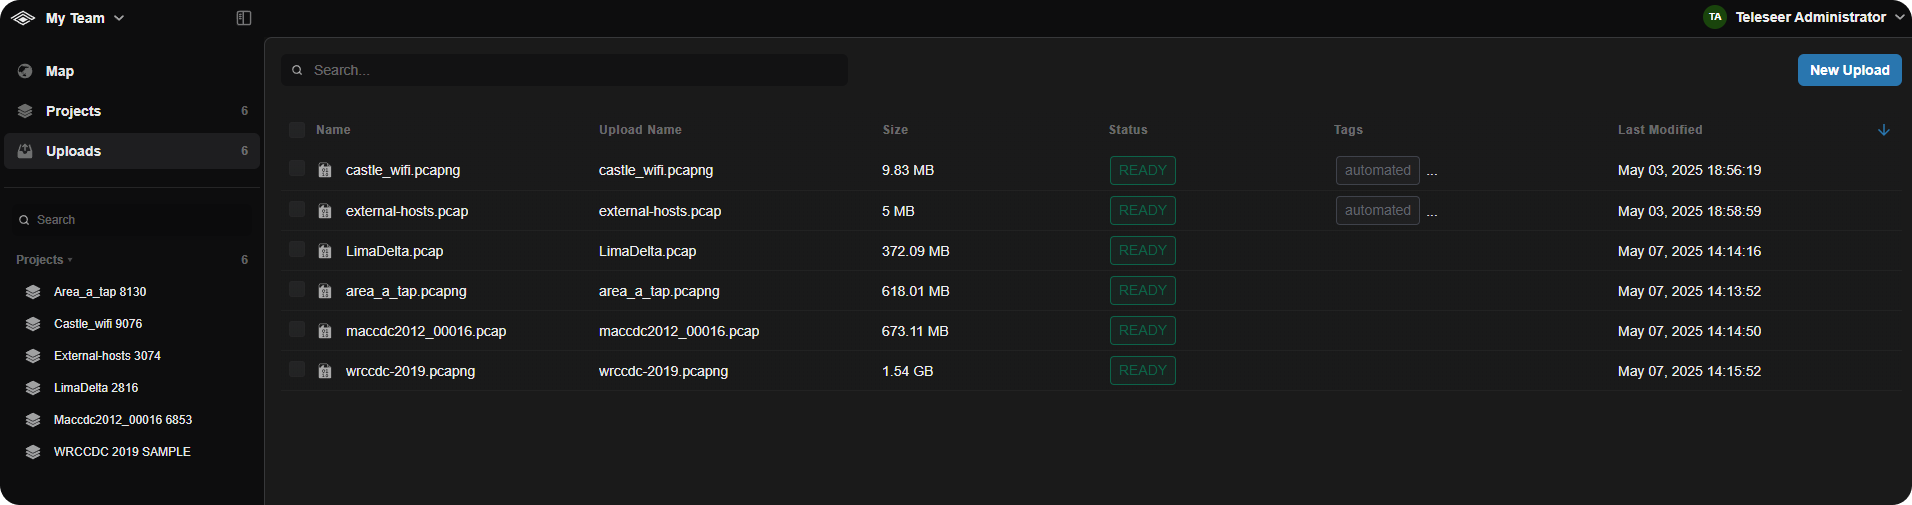
Workspace
The Teleseer workspace displays tenant-specific content such as uploads and projects, and provides access to the map.
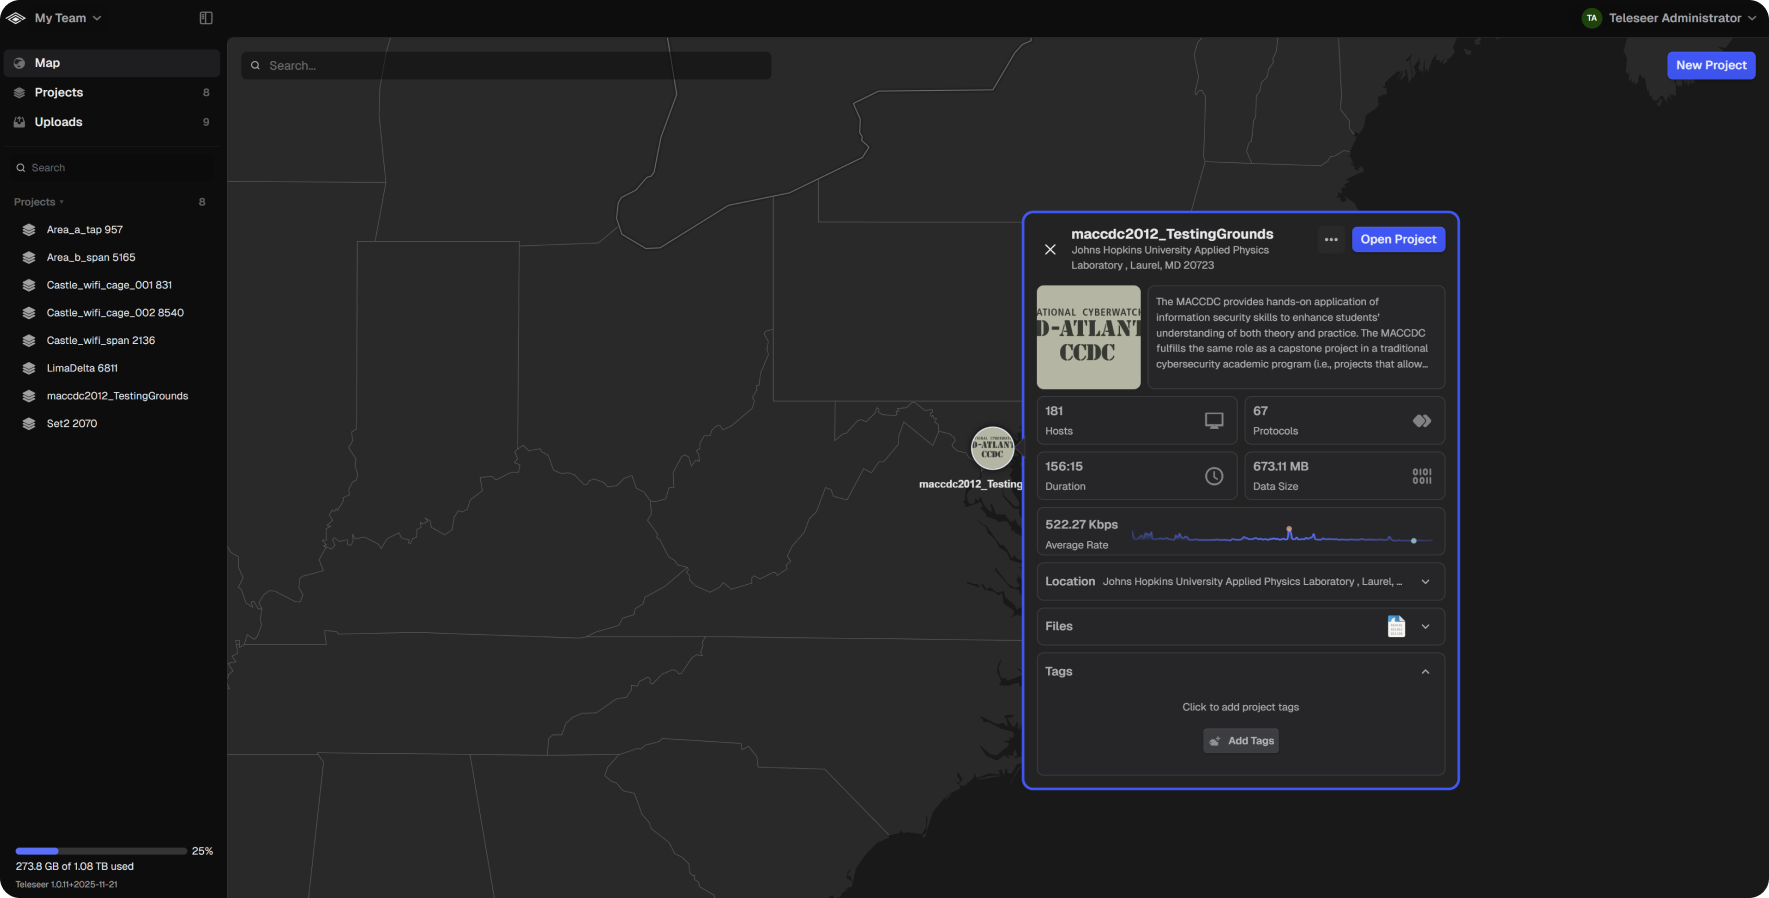
Map Panel
The Map Panel displays the physical location of a project.
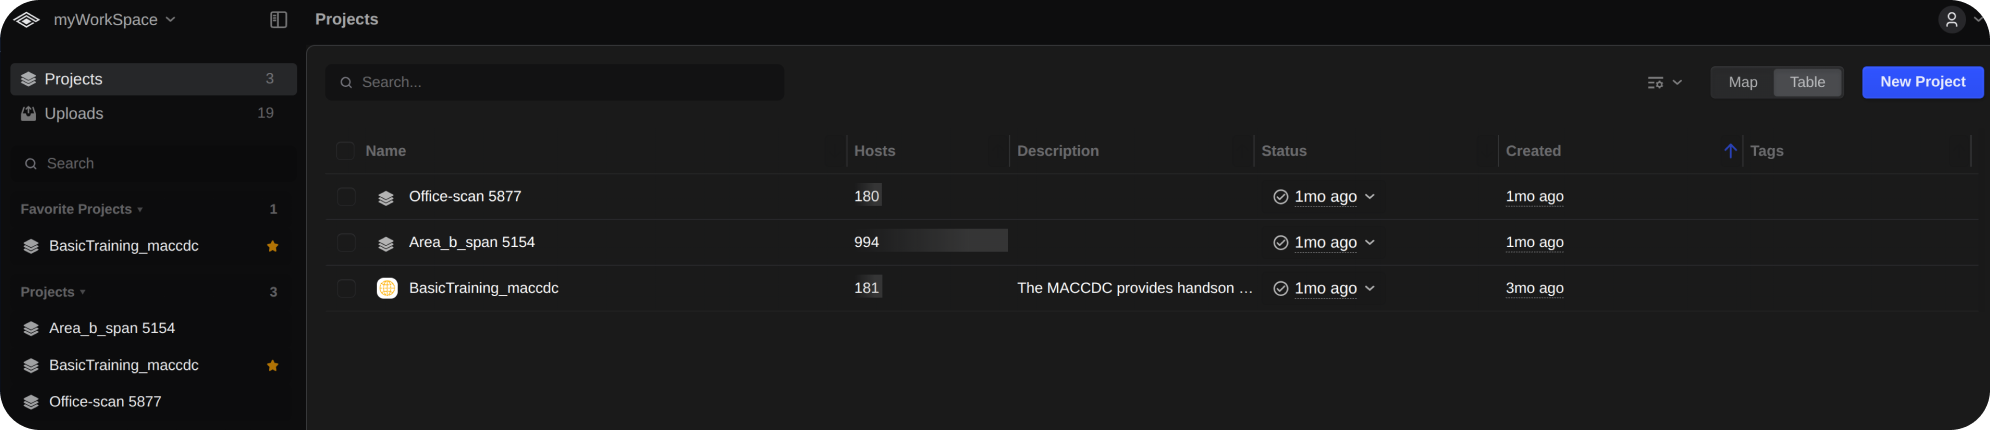
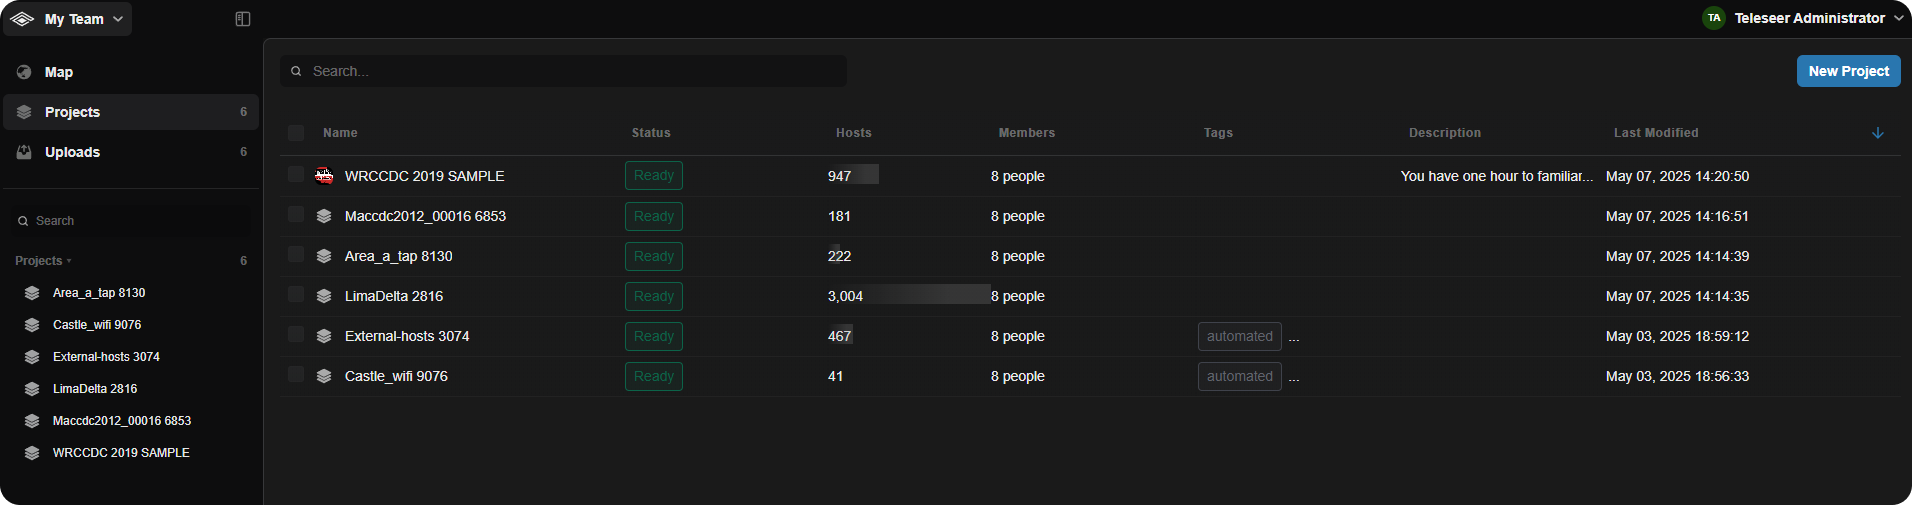
Projects Panel
The Projects Panel displays all projects within the current tenant. Projects can be created, modified, and deleted from this panel.
Uploads Panel
The Uploads Panel displays all uploaded files within the current tenant. Uploads can be created, modified, deleted, and used to create new projects from this panel.
Project Page
The Teleseer project page consists of three main panels:
- Viewer
- Inspector
- Timeline
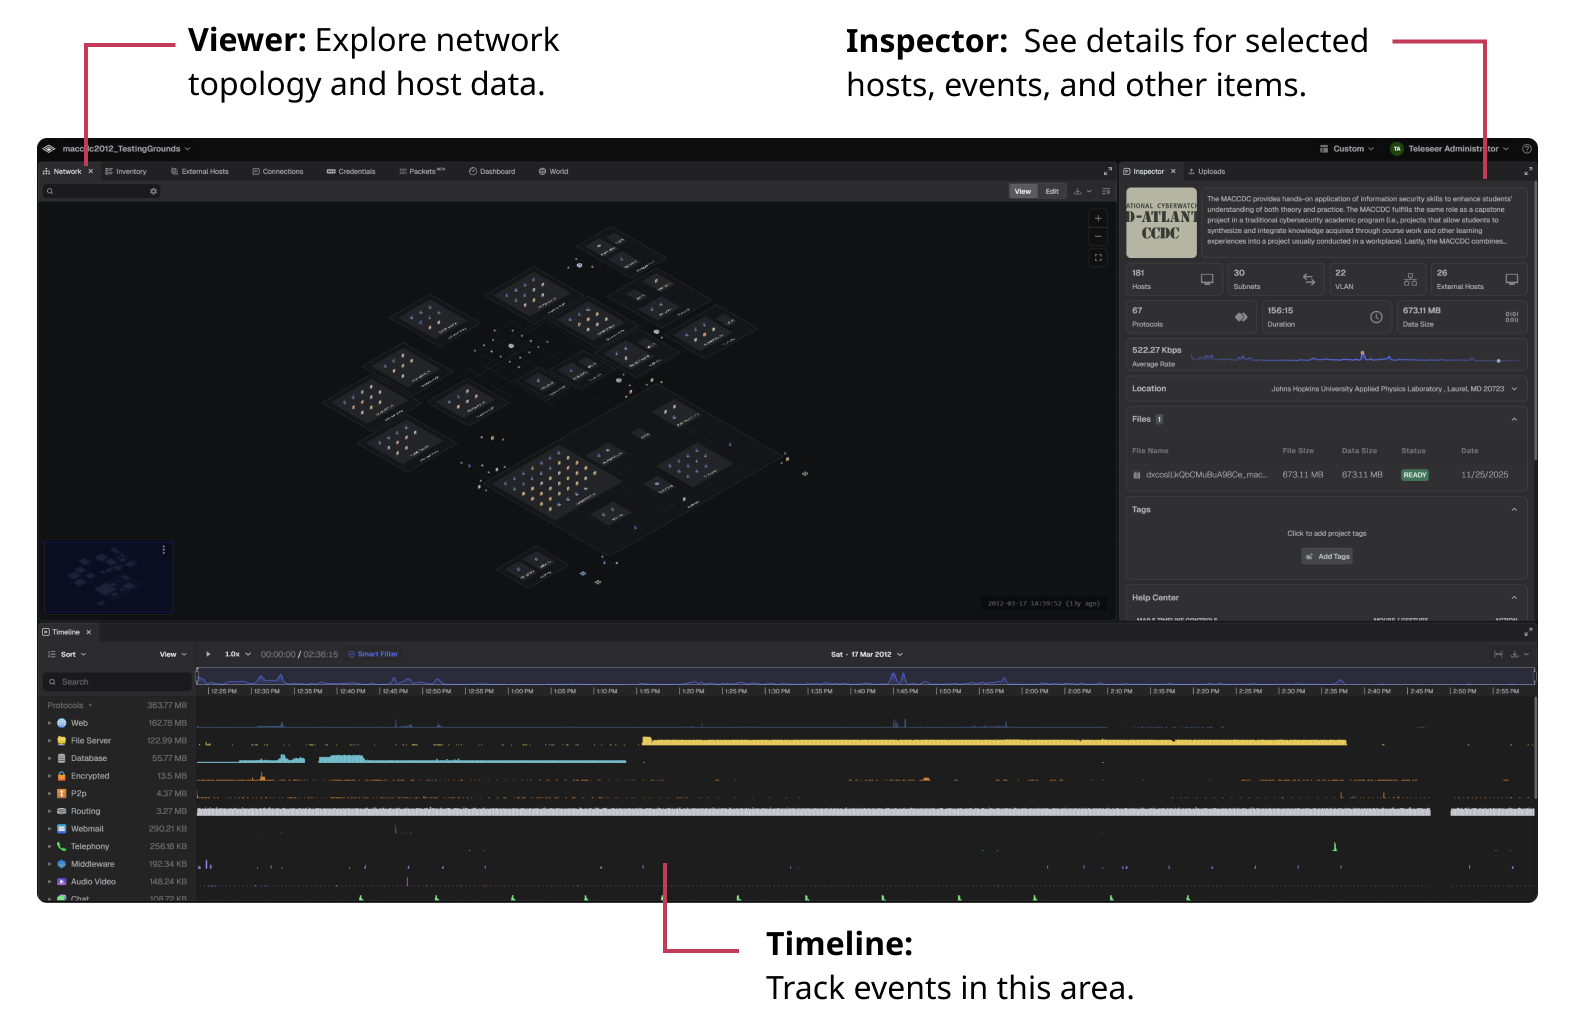
Viewer
The viewer section contains the Network topology, internal Inventory table, External Hosts table, Flows table, Credentials table, Packets table, the Dashboard, and a World map.
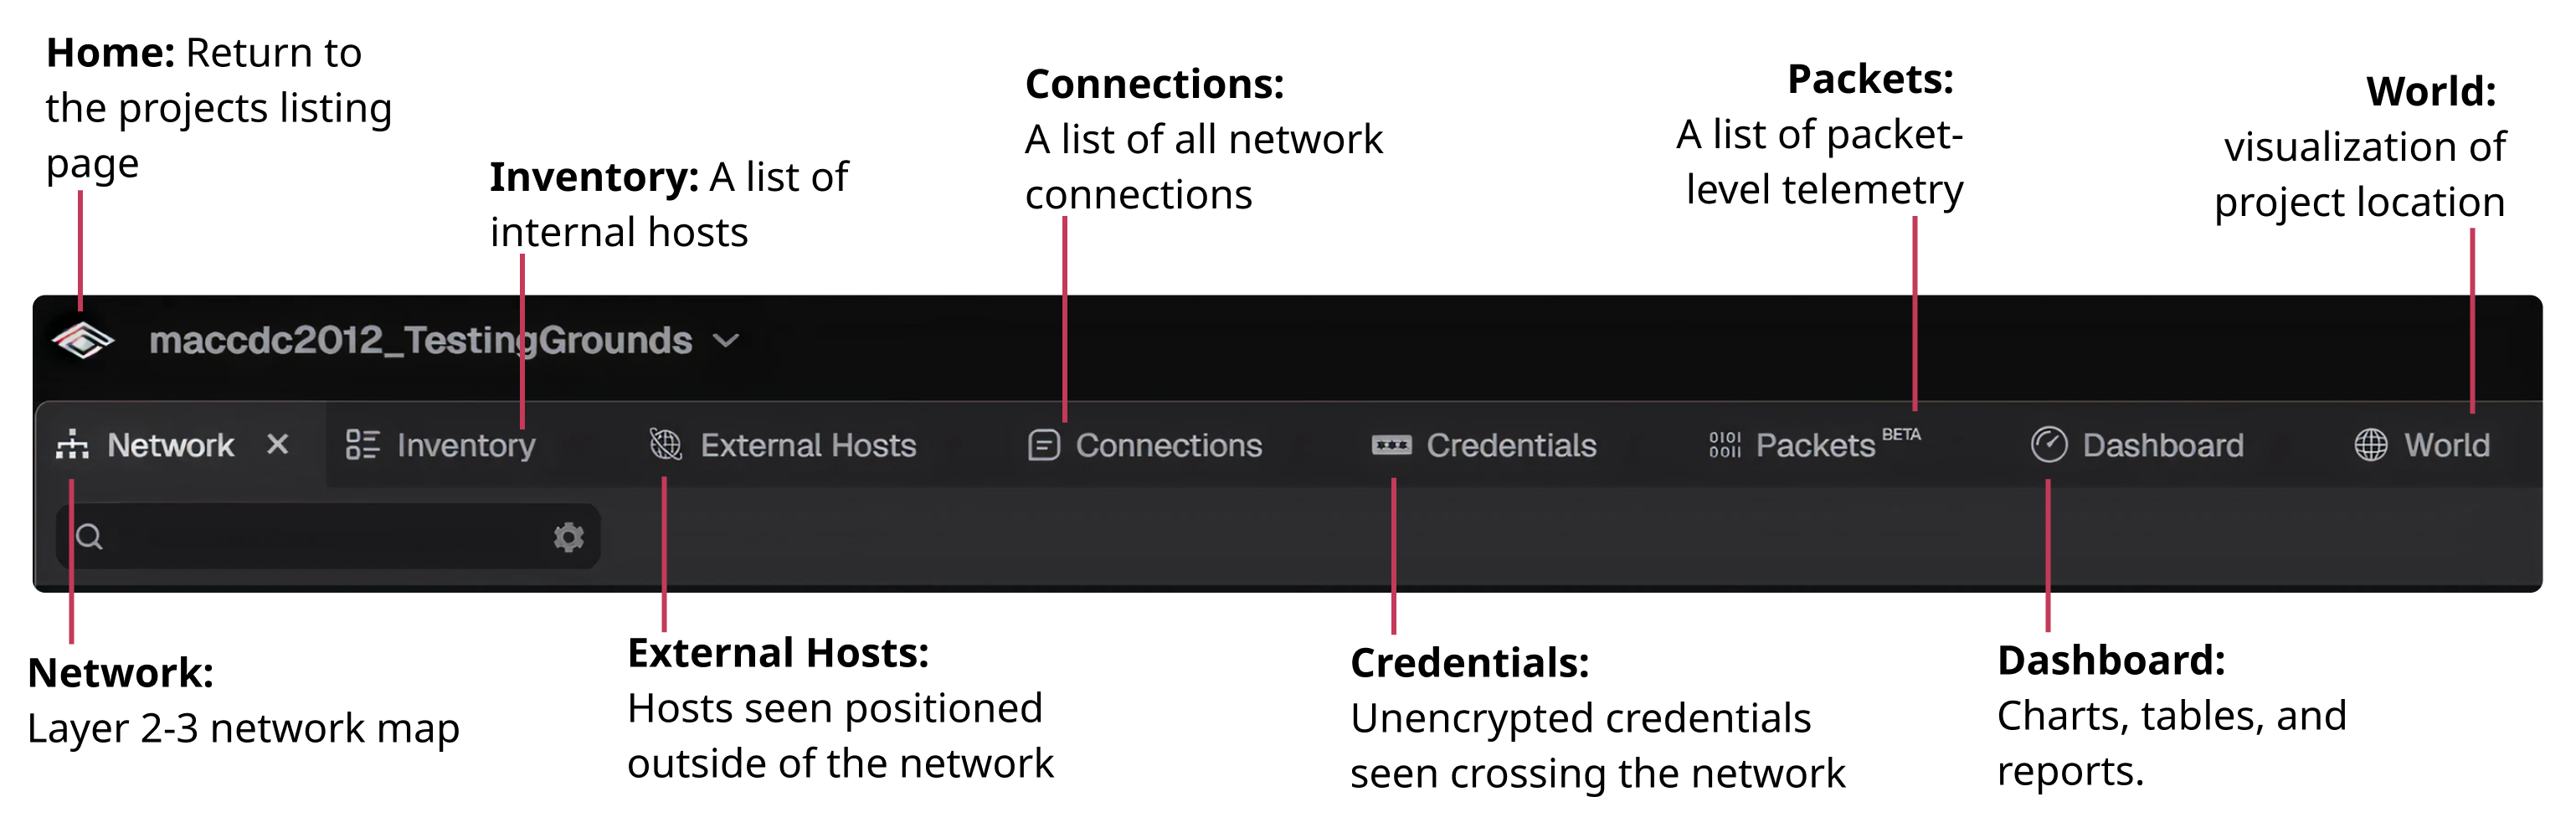
Network
The Network tab displays a visualization of the reconstructed network topology, showing all logical connections between hosts and has the ability to show observed traffic flows between communication endpoints. Hovering over a host provides a high-level summary.
Inventory
The Inventory displays all identified hosts in a sorted table. Selecting a row updates the inspector panel with detailed information about the selected host.
External Hosts
External Hosts include all hosts determined to be outside the network boundary, as determined by the sensor location and Teleseer's analytics or as specified by the user via project settings. The table supports sorting, and selecting a row reveals additional host details in the inspector panel.
Note: If a host does not have layer 2 information when uploaded it will appear here.
Flows
The Flows table displays all network flows within the current project and supports searching and sorting.
Credentials
The Credentials table lists all plaintext usernames and passwords detected by the deep packet inspection engine. Hovering over an item reveals additional information.
Packets (Beta)
The Packets table provides summarized packet details, including the source and destination hosts and ports, the protocol, and packet length. Selecting a packet reveals packet contents in the **Inspector** panel.
Dashboard
The Dashboard provides a bird’s-eye view of the network, using tables and charts to summarize who is connected and activity.
World
The world tab provides a map visualization of the project's location.
Inspector
The Inspector panel displays detailed information for selected hosts, zones, flows, events, and packets. Its contents update dynamically based on the current selection.
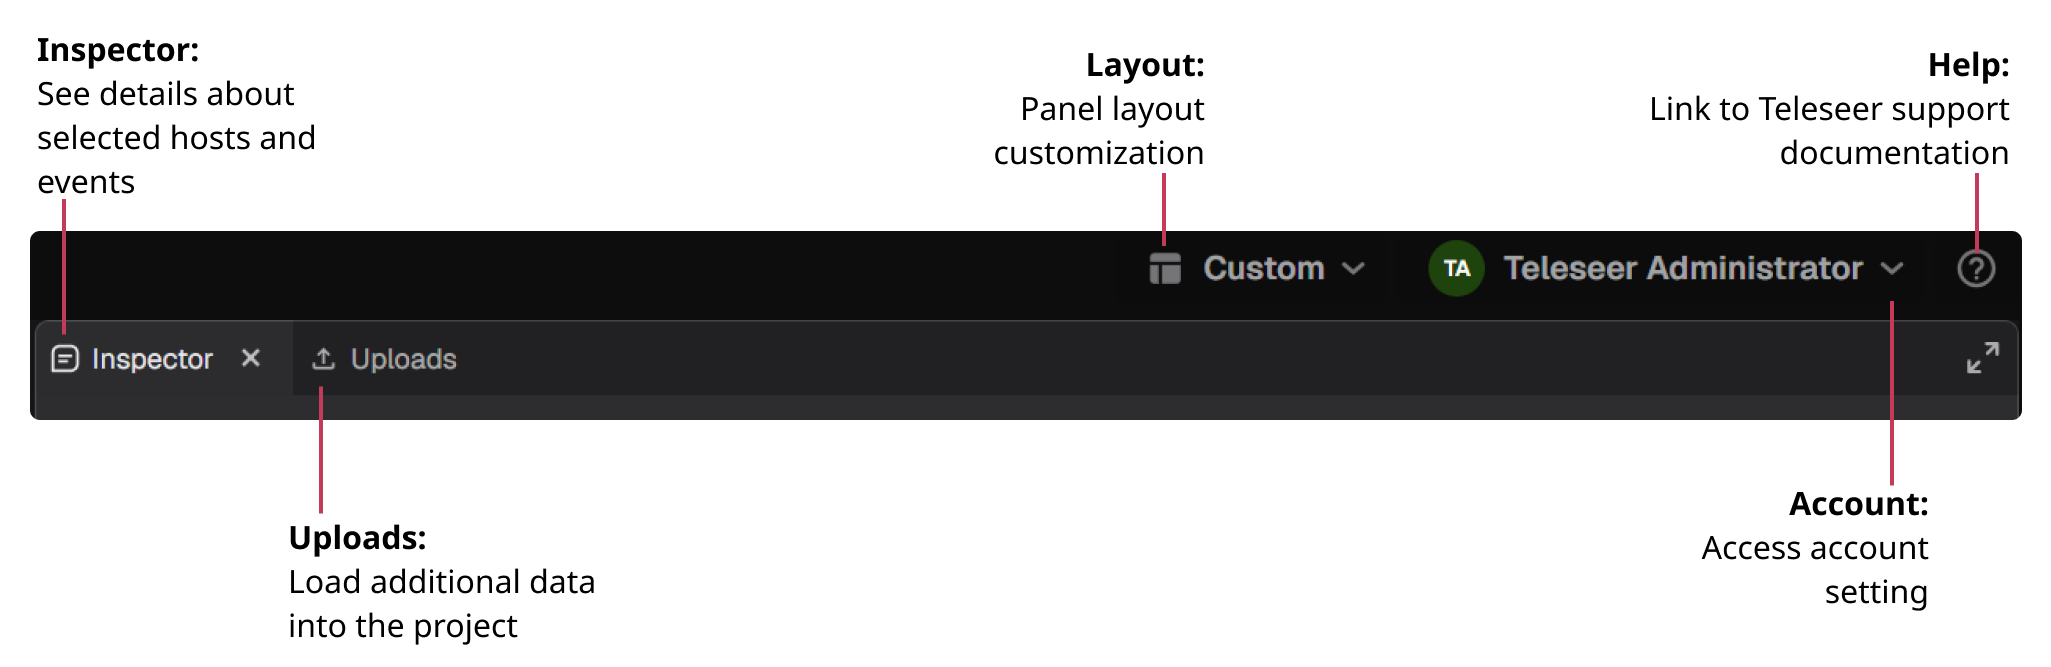
Uploads
The Uploads panel allows users to add additional collection files to the current project.
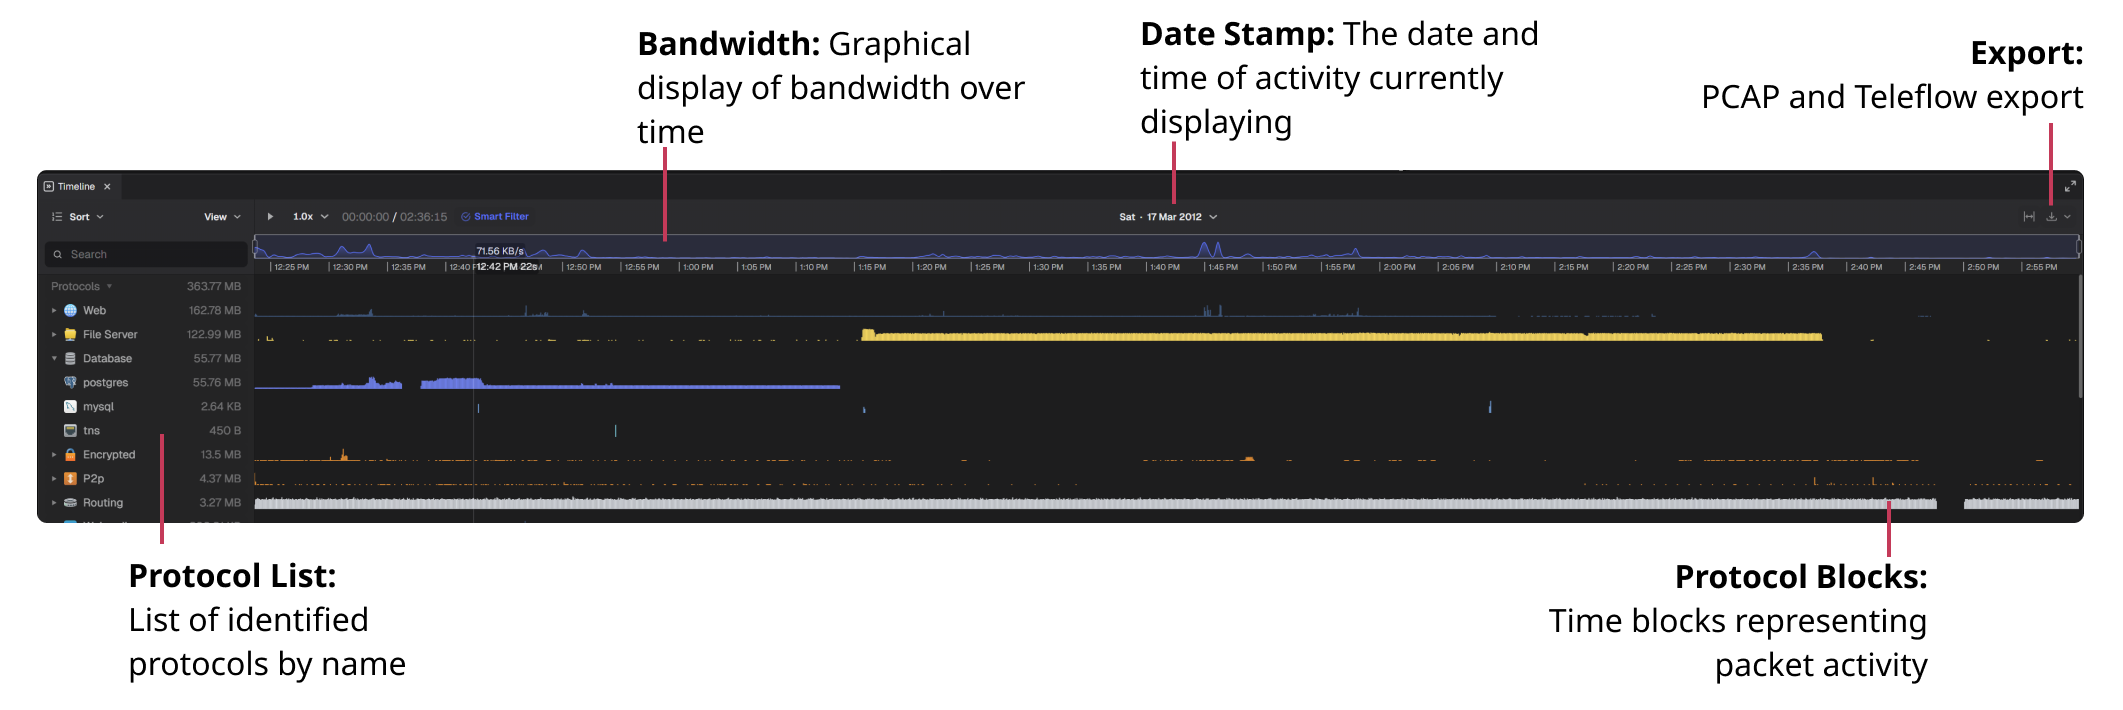
Timeline
The Timeline presents an interactive view of all traffic (swimlanes) captured in the selected file set or generated by selected host(s). Each block within the timeline represents a point in time where data was transferred over the network. Hovering over a protocol block shows the amount of data transferred during that time period. Selecting a block will populate the Inspector panel connection details.
When the Smart Filter is enabled (by default), selecting host(s) within the topology automatically filters the timeline to show only traffic generated by those host(s).