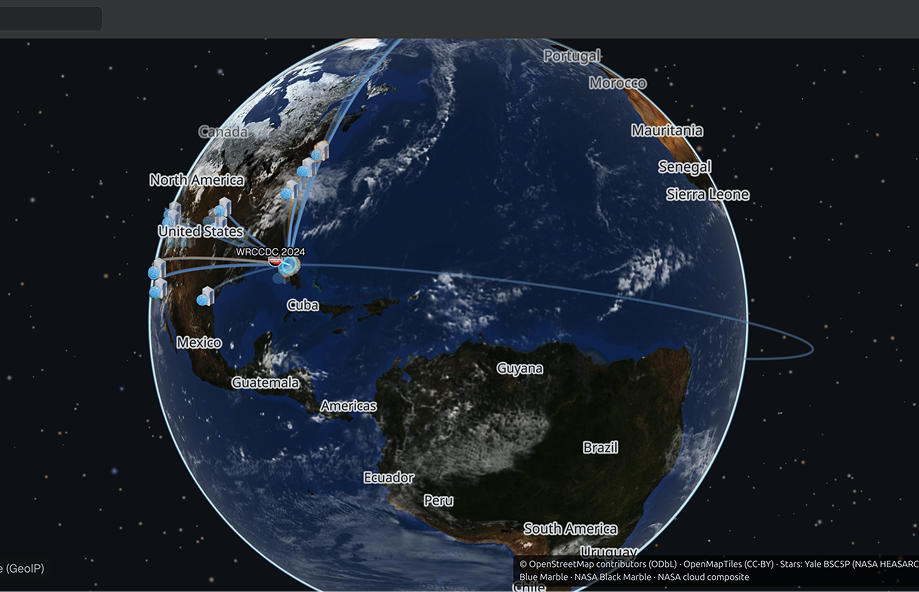
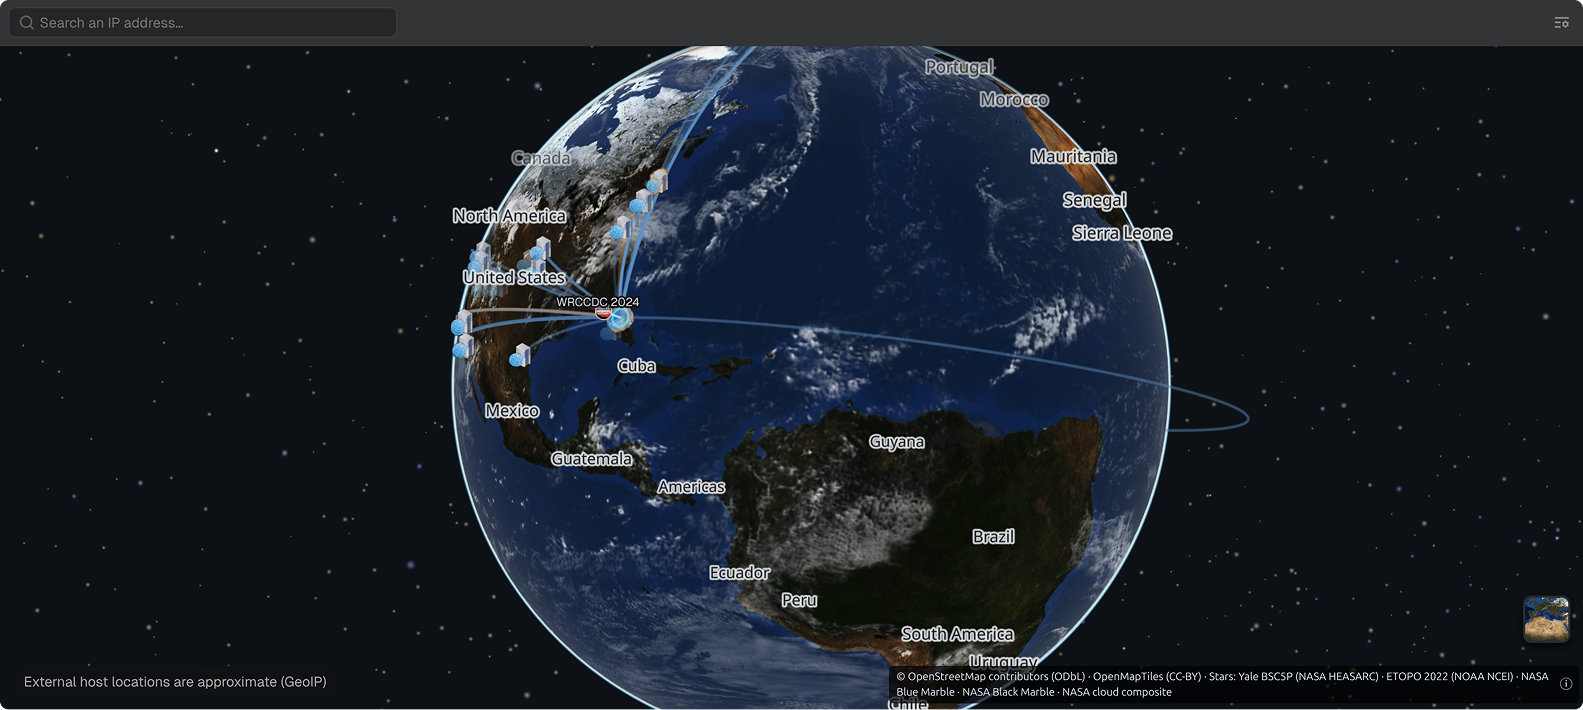
World Panel - A new and improved world panel plots hosts on a 3D globe by geographic location and draws flow arcs between them from a timeline selection. Hosts without a known location appear at the location assigned to the project.
World Panel
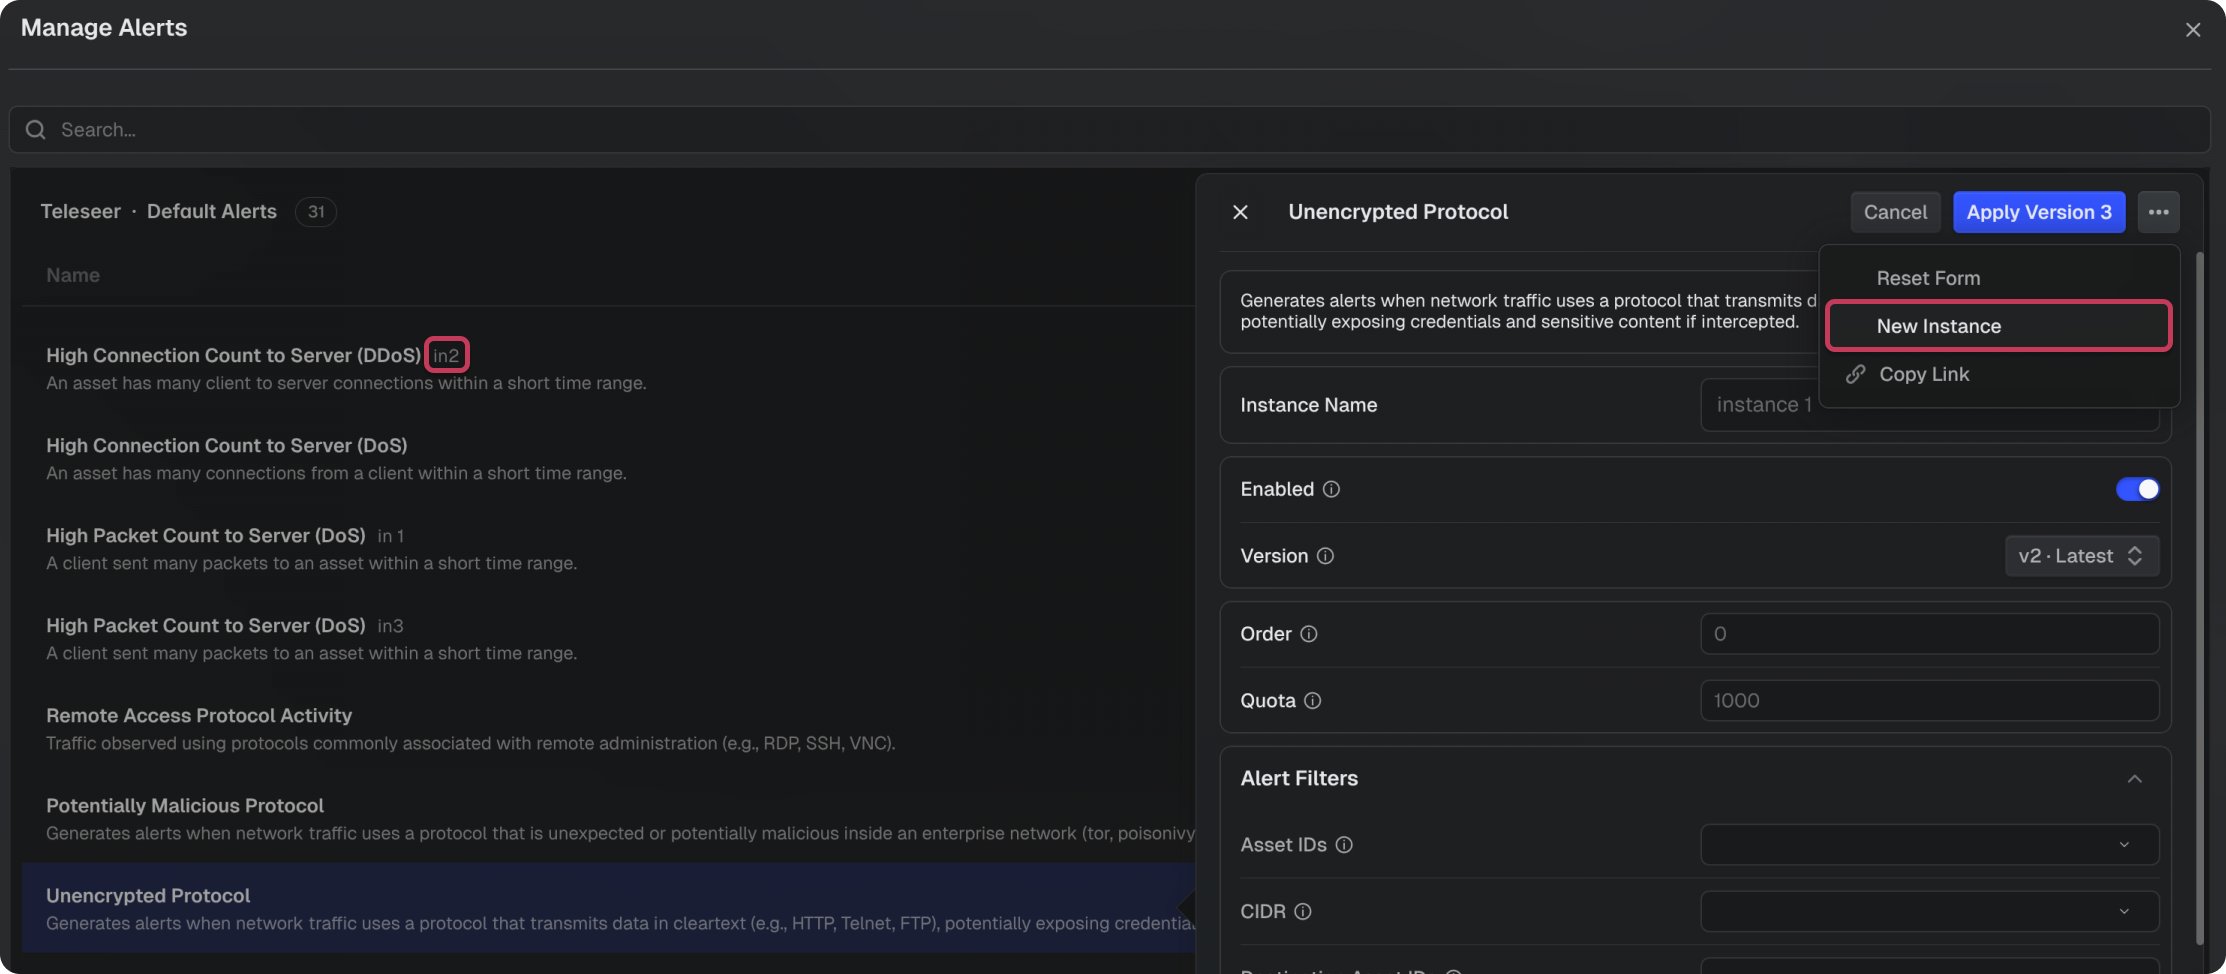
Multiple Alert Generator Instances - Multiple instances of the same alert type can now run at the same time, each with its own enabled state, quota status, configuration and version history. Instance names appear alongside generator titles in Manage Alerts and in the alerts table, so alerts can be traced back to the configuration that produced them.
Manage Alerts
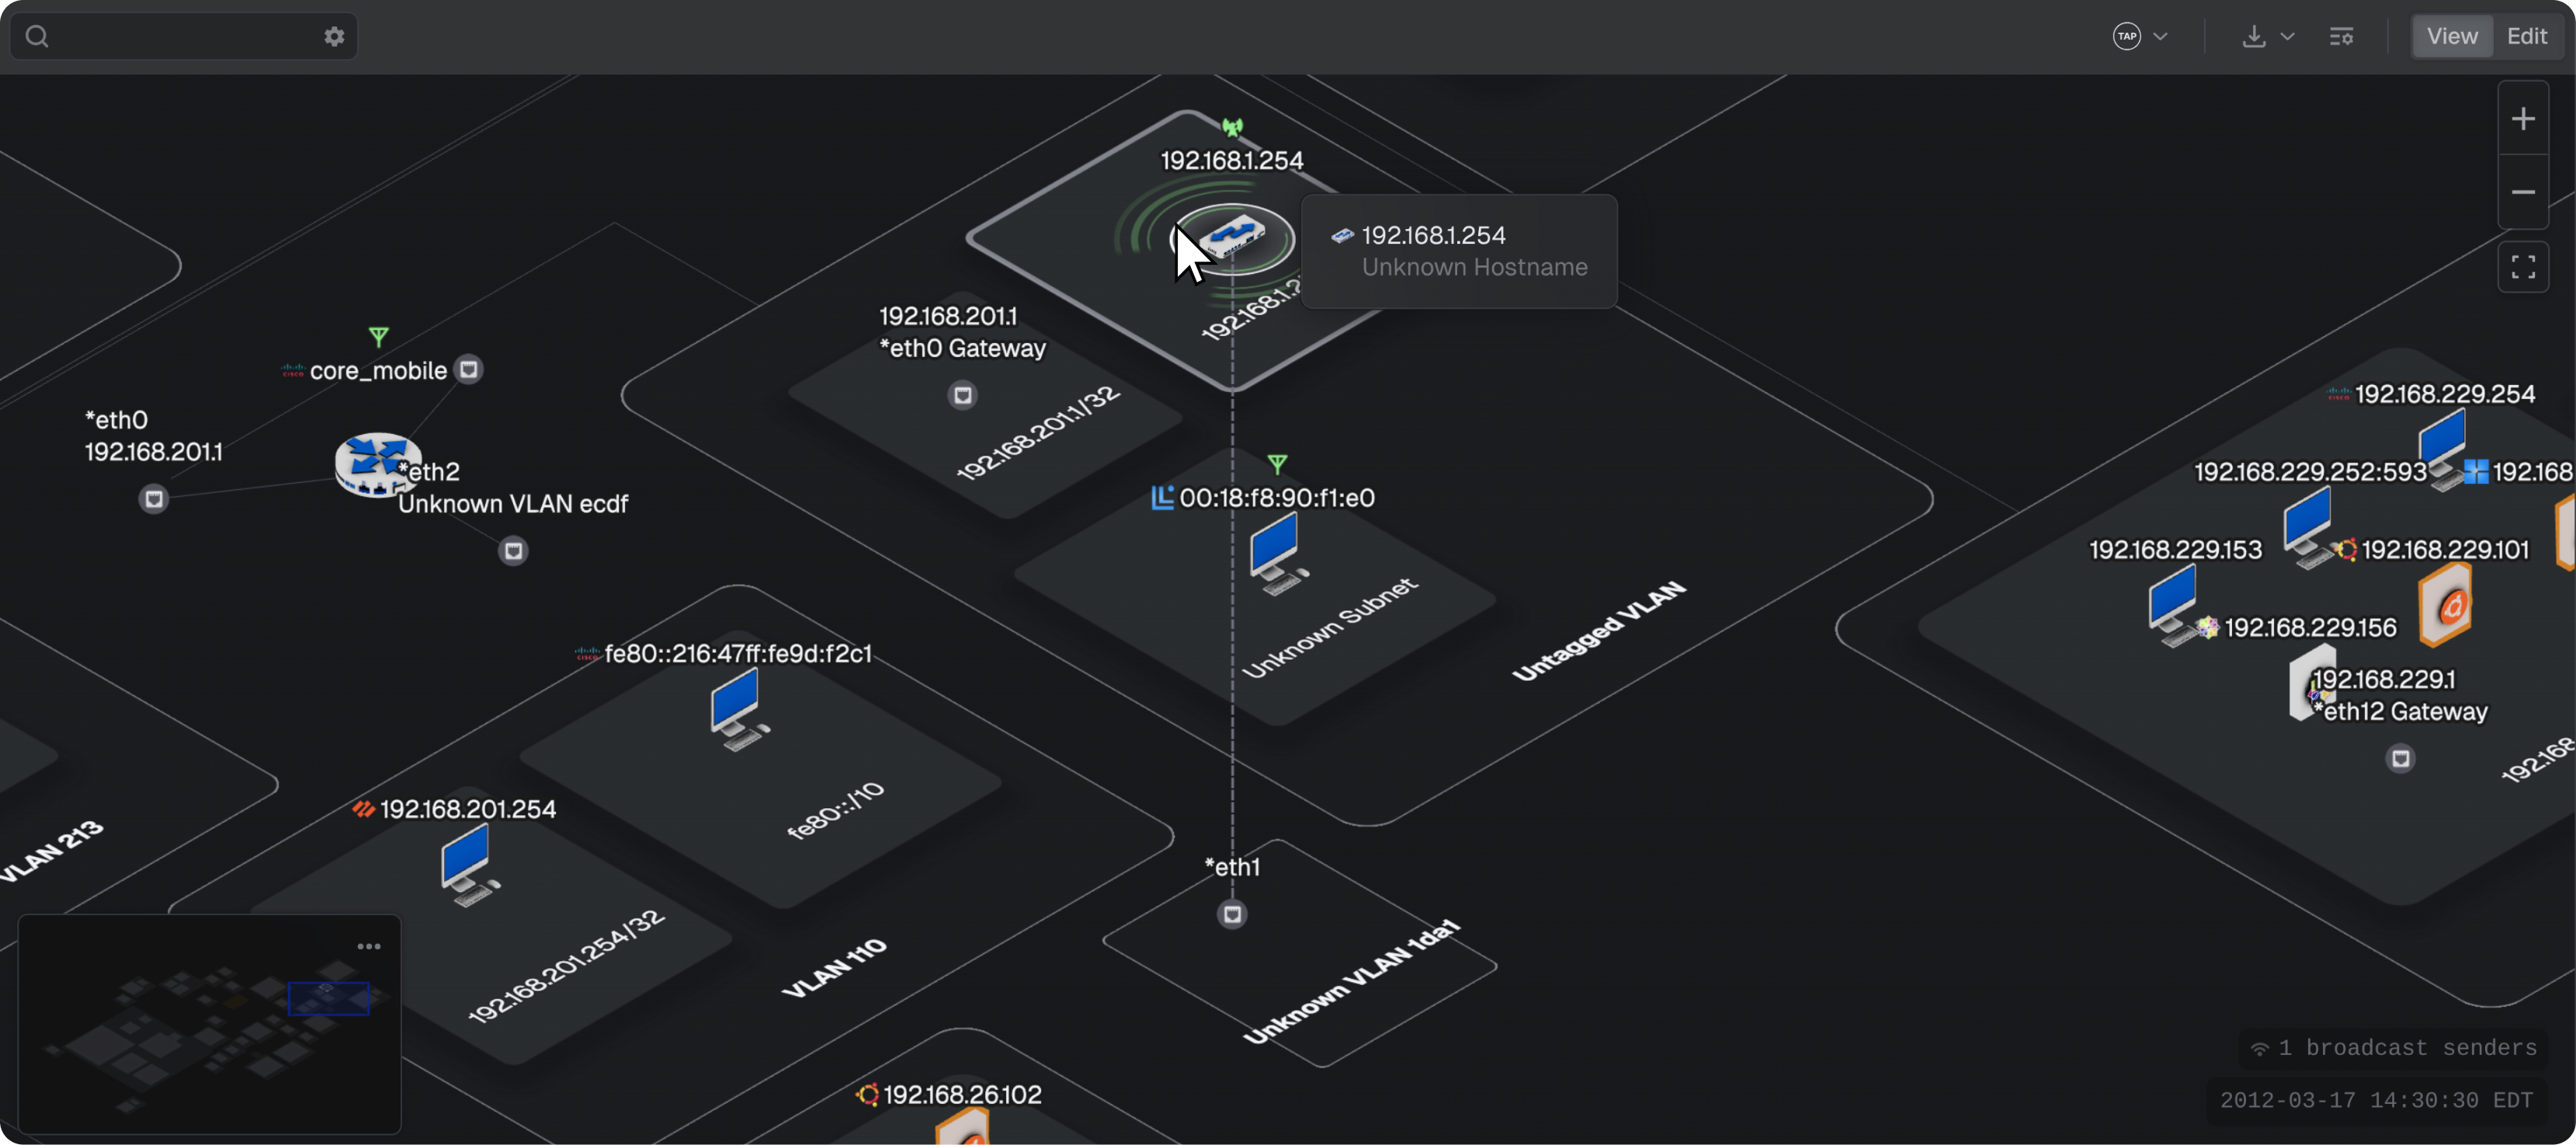
Broadcast and Multicast Visualization - Broadcast and multicast traffic now appears in the network topology, with a ring on each sending host and green antenna icons on the hosts receiving the traffic. Hovering a row in the Flows table or selecting traffic in the timeline highlights the matching hosts.
Broadcast and Multicast Visualization
OPTIMIZATIONS & ENHANCEMENTS
3D Network View by Default - The Network panel now opens in 3D instead of 2D. Both modes remain fully available, and switching between them works as before.
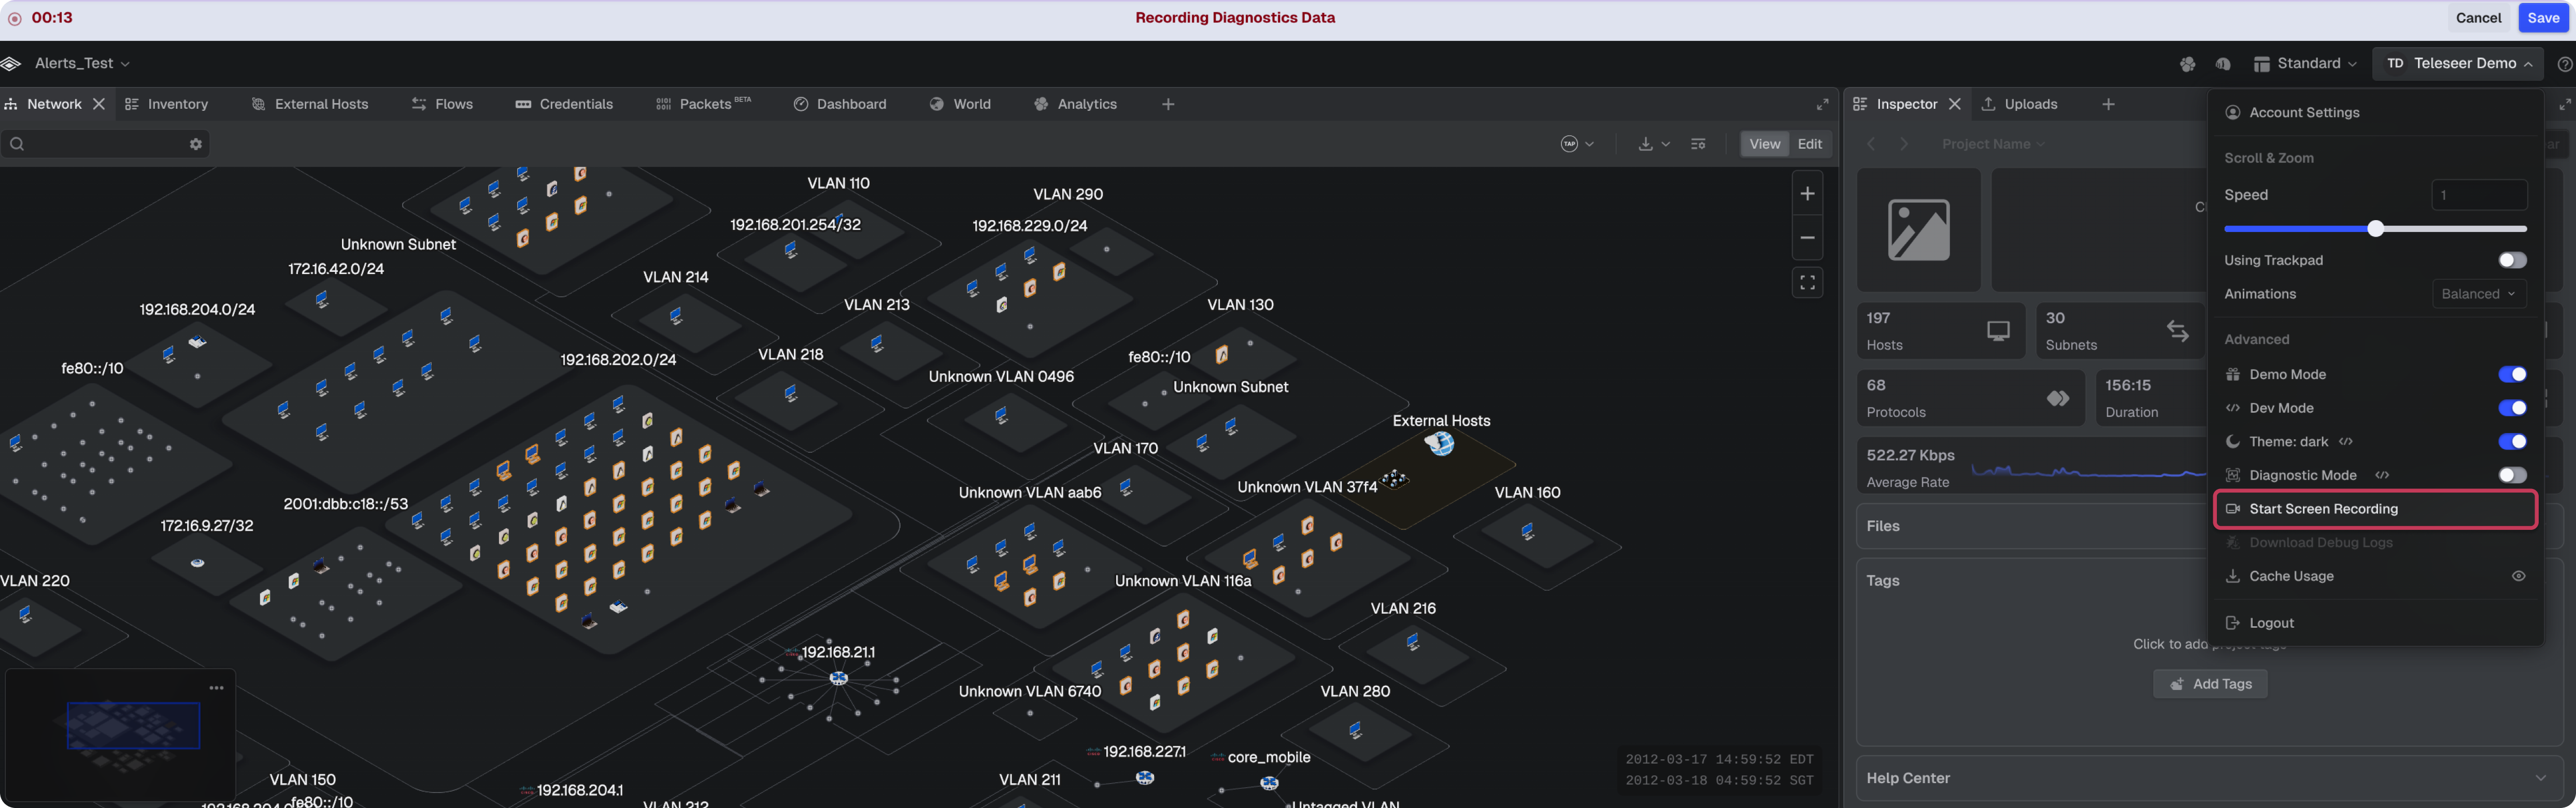
Screen Recording - Diagnostic Mode is no longer required to report an issue because screen recording now captures network and console logs for the duration of the recording.
Screen Recording
FIXES
Project Tag Entry - Pressing ‘Enter’ to commit a tag while creating a project no longer clears the Project Name and Description fields, so project creation completes normally.
Traffic Flow Animation - Selecting all protocols in the timeline no longer freezes the animated traffic flows in the 3D network view.
Customize Timeline View Search and Sort - Search and sort in Customize Timeline View now apply to the Events dropdown.
Asset Icons After Ingest - Asset icons now appear in the 3D network view as soon as analysis completes. A page refresh was previously needed when ingest started while the map was already in 3D.
Gateway Drill-Down - Selecting an individual gateway from the Gateways table in the Inspector now drills down to that specific gateway.
Alert Hover Highlighting - Hovering over an alert row in the Inspector highlights that alert in the timeline.
Suricata Rule Name Column - Rule details in the Name column of the Suricata Ruleset table now stay within their own row instead of overlapping.
Packet Selection History - Returning to an earlier packet selection through the Inspector selection history now restores the correct packet count and details.
Project Destinations - The Destinations section of the Project Overview now displays its data, and exporting the Project Overview includes that section in full instead of cutting it off.
Zone Context Menu - Dragging the network view with the right mouse button no longer opens the context menu on a zone.
Alert Table Column Resizing - The Description column in alert tables can now be resized, which makes long values readable.
Row Actions - The row actions menu now appears for IP addresses with an unknown host icon in the Flows and Inspector panels.
Flows Table- The Flows table in the Inspector now lists every flow for a selection. Rows previously went missing when the pagination count increased.
Arcs with Hosts Selected - Selecting traffic in the timeline now draws the corresponding arcs on the network map when hosts are selected. The arcs previously appeared only when no host selection was active.
Export During Project Load - Exports no longer cancel while a project is building.
Selected Event Count - The timeline selection indicator now shows the number of selected events.
GreyNoise Tags - GreyNoise enrichment tags now appear in the Tags column of the External Hosts table.